Independent knowledge base software guide Evidence-led Updated 2026

Knowledge Base Analytics for Product Teams: Turning Search Queries Into Roadmap Insights
Product teams already have a hidden stream of product intelligence sitting inside their help center.
Every day, users search your knowledge base when they are blocked, confused, comparing options, trying to complete a workflow, or looking for something the product does not make obvious. Yet in many SaaS companies, those searches are treated as a support metric: useful for improving articles, but rarely important enough to influence product planning.
That is a missed opportunity.
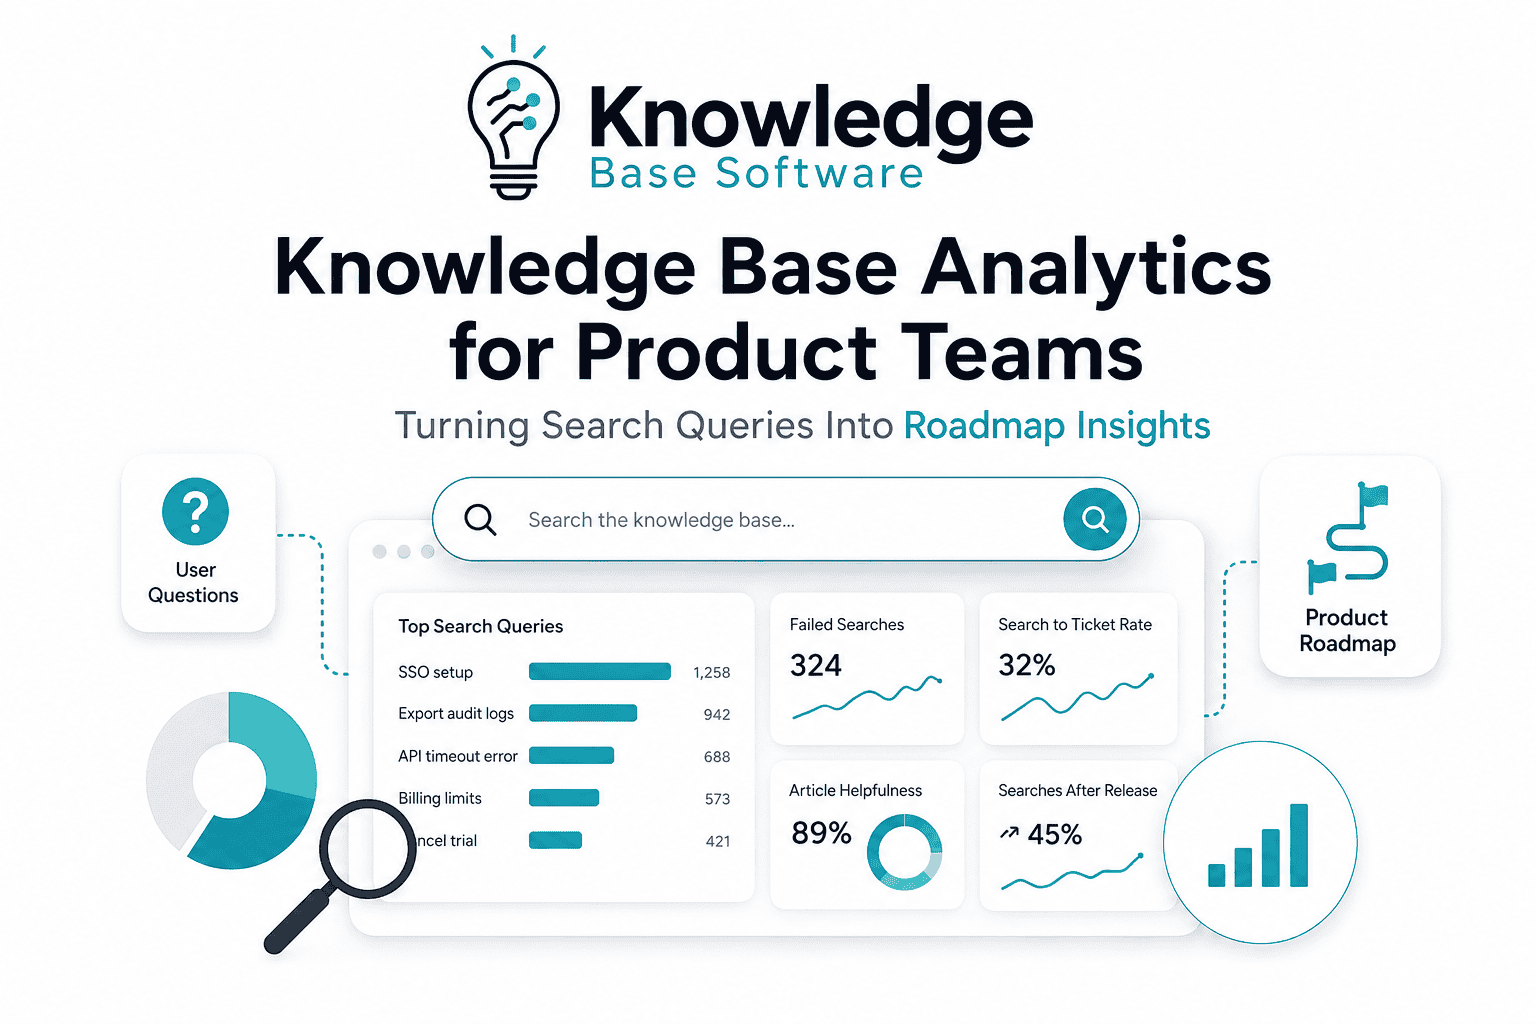
Knowledge Base Analytics for Product Teams is about turning self-service behavior into product intelligence. Search queries, failed searches, article feedback, chatbot gaps, and search-to-ticket patterns can show where users struggle, what they expected the product to do, and which needs are emerging before they become formal feature requests.
When analyzed correctly, your knowledge base becomes more than a documentation library. It becomes a roadmap intelligence layer.
What Is Knowledge Base Analytics for Product Teams?
Knowledge base analytics is the measurement and interpretation of how users interact with your help center content, internal documentation, search experience, article feedback, chatbot answers, and support deflection paths.
For support and customer education teams, this usually means answering questions like:
- Which articles get the most views?
- Which articles receive negative feedback?
- Which searches return no results?
- Which docs reduce support tickets?
- Which articles need updates?
Those metrics matter. Zendesk, for example, describes knowledge base dashboards around article views, votes, trends, user roles, languages, sections, and authors; Help Scout’s official Docs report explains how teams can review visits, searches, failed searches, top articles, article ratings, and conversations created after browsing Docs.
But product teams need a different lens.
| Traditional knowledge base analytics | Product-focused knowledge base analytics |
|---|---|
| Content performance | Customer intent |
| Article views | Product friction |
| Search success | Unmet user needs |
| Helpfulness votes | Confusing UX or incomplete workflows |
| Support deflection | Roadmap, onboarding, and product discovery signals |
| Documentation gaps | Product, pricing, integration, or reliability gaps |
In other words, traditional analytics asks, “Is the knowledge base working?”
Product-focused analytics asks, “What are users telling us about the product through the way they search for help?”
Why Search Queries Are More Than Support Data
A knowledge base search is not passive browsing. It is usually a user trying to solve a specific problem.
That makes search data especially valuable for product teams.
Search queries capture the user’s own language. They reveal whether users call a feature by your product’s official name, a competitor’s term, an industry phrase, or a completely different mental model. If your interface says “workspace permissions” but users keep searching for “team access,” that is not just a documentation issue. It may be a naming, navigation, or product discoverability issue.
Searches also happen at moments of friction. A user searching “API timeout,” “invite user permissions,” “export audit logs,” or “cancel trial” is not casually reading. They are trying to move forward.
This makes help center search a useful early warning system. Before users open tickets, complain on sales calls, churn, or request a feature, many of them search.
Intercom’s own help center guidance notes that repeated searches for features a product does not have can be useful data to feed back to the product team.
For product teams, knowledge base search queries can reveal:
- repeated confusion around onboarding;
- missing or poorly named product capabilities;
- unclear pricing, plan limits, or billing flows;
- demand for integrations or advanced workflows;
- bugs, reliability issues, or release regressions;
- enterprise requirements such as SSO, audit logs, permissions, API access, migration, or compliance exports.
The goal is not to turn every search query into a feature request. The goal is to interpret search behavior as one product signal among many.
The Knowledge Base Signals Product Teams Should Track
The strongest insights usually come from combining multiple signals, not from looking at search volume alone.
| Signal | What it may mean | Product team action |
|---|---|---|
| Most-searched terms | Users repeatedly need help with a product area | Review UX, onboarding, naming, and docs |
| Zero-result or failed searches | Users cannot find content, or the product lacks what they expect | Create content, rename articles, or validate product demand |
| High-search, low-click queries | Search results are irrelevant or article titles do not match user language | Improve search relevance, metadata, and article naming |
| High-search, high-ticket queries | Self-service is not resolving the issue | Investigate product friction, support gaps, or unclear workflows |
| Repeated searches in the same session | User remains blocked after searching | Review journey, article quality, and in-app guidance |
| Search-after-article-view behavior | Article did not fully answer the question | Expand article, add troubleshooting steps, or fix UX |
| Negative article feedback | Content may be outdated, incomplete, or misaligned with intent | Audit article and related product experience |
| Helpful article votes with high ticket creation | Content is useful but issue may still require product or support action | Identify workflow complexity or missing automation |
| Chatbot unanswered questions | AI or bot content does not cover real customer intent | Add content, improve retrieval, or flag product gaps |
| Internal agent searches | Support agents repeatedly need help answering the same topic | Improve internal enablement or simplify product behavior |
| Searches by plan, segment, persona, or account tier | Different customer groups have different pain points | Prioritize by business impact and customer segment |
| Sudden spikes after a release | New feature, bug, or UI change caused confusion | Review release notes, tickets, analytics, and QA findings |
| Queries mentioning competitors | Users are comparing workflows or considering migration | Send insights to product marketing and product strategy |
| Queries mentioning integrations | Integration setup or demand may be unclear | Improve docs, guided setup, or integration roadmap |
| Queries mentioning pricing, permissions, export, API, SSO, errors, limits, or migration | High-intent commercial or technical friction | Route to product, support, success, or sales depending on severity |
A failed search should not automatically become a content ticket. A failed search for “dark mode” may require a feature decision. A failed search for “change invoice email” may require a better billing article. A failed search for “audit log export” from several enterprise accounts may deserve roadmap discussion.
From Search Query to Roadmap Insight: A Practical Workflow
A useful knowledge base analytics process needs more than a dashboard. It needs a workflow that turns raw search behavior into product decisions.
Step 1: Capture search data
Start by collecting:
- search term;
- timestamp;
- pseudonymous user ID, account ID, or account segment, only where legally permitted, privacy-compliant, and free of PII sent to analytics tools;
- session ID;
- clicked result;
- zero-result status;
- article viewed before and after search;
- ticket created after search;
- account plan, segment, persona, and lifecycle stage;
- release version or product area.
If you use GA4, site search can be captured through the view_search_results event, and Google’s documentation notes that the search_term parameter populates the Search term dimension. By default, GA4 can trigger site search tracking from query parameters such as q, s, search, query, and keyword. Keep search terms and identifiers free of PII, and use GA4 User-ID only according to Google’s User-ID and privacy policies.
Step 2: Clean and normalize queries
Users write messy searches.
Normalize spelling variations, plurals, synonyms, product nicknames, and repeated phrases. For example:
- “sso,” “single sign on,” and “single-sign-on” should be grouped.
- “invite user,” “add teammate,” and “team access” may belong to the same permission cluster.
- “export logs,” “audit export,” and “download audit trail” may indicate the same enterprise workflow.
Do not over-clean the data. The exact words users choose are part of the insight.
Step 3: Cluster by intent and product area
Group queries by both intent and product area.
For example:
- Product area: Authentication
Intent: setup, troubleshooting, enterprise configuration - Product area: Billing
Intent: plan limits, cancellation, invoice changes - Product area: API
Intent: rate limits, authentication, errors, missing endpoints
This makes the data useful for product managers who own different surfaces of the product.
Step 4: Enrich with customer context
A search from a free trial user and the same search from a strategic enterprise account should not be weighted the same way.
Add context such as:
- account value;
- plan;
- industry;
- lifecycle stage;
- renewal date;
- persona;
- feature usage;
- support history;
- customer health score.
This turns “150 searches for SSO” into a more useful insight: “37 enterprise admin users searched for SSO setup in the last 30 days, and 18 created tickets after failing to find a useful result.”
Step 5: Separate documentation gaps from product gaps
This is the most important step.
A search query can point to several different problems:
| Problem type | What it looks like | Likely owner |
|---|---|---|
| Content gap | No article exists for a common workflow | Customer education |
| Search relevance gap | Article exists, but search does not surface it | Knowledge management |
| UX confusion | Users search for a task that should be obvious in-product | Product design |
| Feature request | Users search for a capability the product does not support | Product management |
| Bug or reliability issue | Searches mention errors, failures, or broken workflows | Engineering |
| Onboarding friction | New users repeatedly search basic setup questions | Product + customer education |
| Pricing or packaging confusion | Users search limits, plans, invoices, cancellation, or billing rules | Product + growth + finance |
| Integration gap | Users search for setup or availability of external tools | Product partnerships or integrations team |
Step 6: Score the opportunity
Not every signal deserves roadmap space. Score the strongest clusters using a consistent model.
Step 7: Validate with other sources
Knowledge base search data is a signal, not a verdict.
Validate it against:
- support tickets;
- customer interviews;
- sales call notes;
- product analytics;
- session recordings;
- churn reasons;
- NPS or CSAT comments;
- in-app behavior;
- roadmap requests.
Atlassian describes a useful product feedback workflow as moving from customer feedback to organized insights, prioritized ideas, roadmap planning, and delivery work.
Step 8: Decide the action
The right response may be:
- publish or update an article;
- improve article titles and metadata;
- add an in-app tooltip;
- rename a navigation item;
- redesign a workflow;
- fix a bug;
- update pricing copy;
- create a guided setup flow;
- add a feature to discovery;
- reject the request but explain the workaround.
Step 9: Close the loop
Share outcomes with support, success, product marketing, and customers.
A closed-loop system might say:
“Users searched for ‘audit log export’ 84 times last month, mostly from enterprise accounts. We validated the need with 12 tickets and 4 sales opportunities. The feature is now in discovery. In the meantime, we published a workaround article and enabled support with approved messaging.”
How to Classify Knowledge Base Search Queries
The fastest way to make search data useful is to classify query patterns.
| Query pattern | Likely interpretation | Example | Best next action |
|---|---|---|---|
| “How do I…” | Onboarding or discoverability issue | “How do I invite a client?” | Improve onboarding, docs, and in-app guidance |
| “Can I…” | Capability or feature expectation | “Can I export audit logs?” | Validate demand and classify as feature expectation |
| “Error / not working” | Bug or reliability signal | “API timeout error” | Escalate to engineering and monitor tickets |
| “Integration name + setup” | Integration friction | “Salesforce setup” | Improve setup guide or integration UX |
| “Export / API / permissions” | Advanced workflow need | “API permissions export” | Review enterprise workflow requirements |
| “Pricing / limit / plan” | Packaging clarity issue | “billing limits Pro plan” | Improve pricing docs and billing UI |
| “Alternative / competitor” | Positioning or migration signal | “Import from Asana” | Share with product marketing and migration team |
| Repeated “where is…” | Navigation or information architecture problem | “Where is team settings?” | Review labels, menus, and in-app links |
This classification prevents a common mistake: sending every query to the documentation backlog.
Sometimes the article is missing. Sometimes the feature is missing. Sometimes the product is technically capable but hard to understand.
The Product Roadmap Scoring Model
Use a scoring model to decide which knowledge base signals deserve product discussion.
A practical custom heuristic:
Roadmap Signal Score =
Search Volume + Trend Growth + Ticket Correlation + Customer Segment Value + Revenue / Churn Risk + Strategic Fit + Confidence − Estimated Effort
Treat this as a lightweight internal prioritization model, not a universal formula. Adjust weights and scoring rules to match your product strategy, data quality, customer segments, and decision-making process.
Here is how to define each variable.
| Variable | What it means | Suggested scoring |
|---|---|---|
| Search volume | How often the query or cluster appears | 1–5 |
| Trend growth | Whether searches are increasing over time | 1–5 |
| Ticket correlation | Whether searches lead to tickets | 1–5 |
| Customer segment value | Importance of affected users or accounts | 1–5 |
| Revenue / churn risk | Potential commercial impact | 1–5 |
| Strategic fit | Alignment with product strategy | 1–5 |
| Confidence | Strength of supporting evidence | 1–5 |
| Estimated effort | Design, engineering, operational, and maintenance cost | 1–5, subtracted |
This model is inspired by the same general prioritization principle behind frameworks like RICE and Impact vs. Effort: structured methods help product teams compare opportunities, but prioritization still needs judgment, customer context, business goals, and qualitative insight.
Important warning
Do not let raw search volume alone decide roadmap priorities.
A high-volume query may simply need a better article, clearer naming, or improved search relevance. A low-volume query from enterprise accounts may represent major revenue risk. A sudden spike after a release may be a bug, not a roadmap opportunity.
Search data should influence product decisions, not replace product judgment.
Examples: Turning Knowledge Base Searches Into Product Decisions
Example 1: “SSO setup” returns no useful clicks
A B2B SaaS company notices that many admin users search “SSO setup,” “single sign on,” and “SAML login,” but click-through rates are low.
Insight: This may be a content gap, search relevance issue, or onboarding problem.
Action: Create a guided SSO setup article, add synonyms to search metadata, improve admin UI labels, and place an in-app help link next to the SSO configuration screen.
Roadmap impact: If searches remain high after content and UI improvements, the team may explore a setup wizard.
Example 2: “Export audit logs” grows among enterprise accounts
Searches for “export audit logs” increase among enterprise admins, especially in accounts near renewal.
Insight: This may indicate compliance, security, or procurement requirements.
Action: Validate with customer success, sales, and support. Check whether lost deals or security reviews mention the same need. Score the opportunity using customer value, churn risk, and strategic fit.
Roadmap impact: The product team may add audit log export to discovery, while publishing a temporary workaround or API-based guide.
Example 3: “API timeout” spikes after a release
Within 24 hours of a new release, searches for “API timeout,” “webhook failed,” and “500 error” spike.
Insight: This is likely a bug, regression, or reliability issue.
Action: Escalate to engineering, compare against monitoring data, publish a status or troubleshooting article, and track whether searches decline after the fix.
Roadmap impact: This should not become a feature request. It belongs in incident response, reliability work, and post-release QA review.
Example 4: “Cancel trial” and “billing limits” keep appearing
Trial users search “cancel trial,” “billing limits,” “what happens after trial,” and “upgrade limit.”
Insight: Pricing and packaging may be unclear, or the billing UX may create anxiety.
Action: Improve the billing help article, clarify plan limits in-app, review trial emails, and test whether clearer upgrade messaging reduces support tickets.
Roadmap impact: If confusion persists, product and growth teams may redesign the billing and plan comparison experience.
Building a Dashboard Product Teams Will Actually Use
Most product teams do not need another generic analytics dashboard. They need a decision dashboard.
A useful knowledge base analytics dashboard should include:
| Dashboard section | Why it matters |
|---|---|
| Top search terms by product area | Shows where users most often need help |
| Failed searches | Reveals missing content or unmet expectations |
| Search-to-ticket conversion | Identifies where self-service breaks down |
| Search trends after releases | Detects bugs, confusion, or release communication gaps |
| Article feedback by product area | Shows which product surfaces create unclear help experiences |
| Segment / plan breakdown | Prevents all users from being treated equally |
| Enterprise account queries | Highlights revenue-sensitive friction |
| Queries tied to churn risk | Connects support behavior to business impact |
| Content gap backlog | Gives customer education a clear work queue |
| Product opportunity backlog | Gives product a validated insight stream |
Recommended review cadence
- Weekly support/content review: failed searches, article feedback, obvious content gaps.
- Biweekly product triage: high-impact search clusters, ticket correlations, post-release spikes.
- Monthly roadmap review: validated product gaps, recurring enterprise issues, strategic opportunities.
- Quarterly executive trend review: major friction themes, customer segment patterns, and business impact.
The dashboard should not simply display numbers. It should help teams decide what to do next.
Connecting Knowledge Base Analytics With the Product Stack
Knowledge base analytics becomes much more powerful when connected to the rest of the product and customer stack.
Useful data connections include:
- knowledge base platform;
- GA4 or product analytics;
- helpdesk and support tickets;
- CRM;
- product usage analytics;
- session replay tools;
- roadmap tools such as Jira Product Discovery, Productboard, Aha!, Linear, or similar;
- AI chatbot logs;
- customer success health scores;
- release management tools.
The ideal workflow looks like this:
- A user searches the help center.
- The search is logged with query, session, account, and result data.
- If the user creates a ticket, the query is attached to the ticket.
- If the account is high-value or at-risk, the query cluster receives higher priority.
- Product ops reviews the cluster and links it to a product area.
- Product managers validate it with usage data, tickets, and interviews.
- The team decides: content, UX, bug fix, onboarding improvement, or roadmap item.
Productboard’s feedback documentation describes insights boards as a way to collect, organize, analyze, and process feedback, including linking feedback to product entities. That same principle can be applied to knowledge base search clusters when they are treated as product feedback rather than isolated support data.
Common Mistakes Product Teams Make
Treating failed searches only as content tasks
A failed search may mean an article is missing. It may also mean users expect a feature that does not exist.
Prioritizing volume without customer context
A topic with 500 searches from low-fit users may matter less than 25 searches from strategic enterprise accounts.
Ignoring internal agent searches
Support agents often search internal knowledge bases when they are unsure how to answer customers. Repeated internal searches can reveal confusing policies, weak enablement, or complex product behavior.
Failing to segment by plan or persona
Admin searches, developer searches, finance searches, and end-user searches represent different product needs.
Not reviewing searches after product releases
A release can create confusion even when the feature works as designed. Search spikes after launch are one of the fastest ways to detect unclear UX, missing release notes, or unexpected bugs.
Publishing articles instead of fixing confusing UX
Documentation can support the product, but it should not permanently compensate for an unclear workflow.
Turning every search into a feature request
Some searches require a help article. Some require a UI label change. Some require better onboarding. Some require saying “we do not support this.”
Not closing the loop with support and customers
If support teams feed insights into product but never hear what happened, they will stop contributing.
Letting AI summarize queries without human review
AI can cluster and summarize search data, but product judgment is still required.
AI and Knowledge Base Analytics
AI can make knowledge base analytics faster and more scalable.
It can help teams:
- cluster similar search queries;
- detect emerging themes;
- summarize failed searches;
- draft content gap recommendations;
- route product issues to the right owner;
- identify support trends;
- compare search language with article titles;
- generate first-pass taxonomies for product areas and intents.
For example, AI might group “SAML setup,” “SSO login,” “Okta config,” and “single sign on admin” into one authentication cluster.
But AI also creates risks.
It can invent categories that do not reflect real user intent. It can over-simplify edge cases. It can miss account context. It can expose sensitive customer data if governance is weak. And it can make teams overconfident in summaries that were never validated by support tickets, interviews, or product analytics.
Use AI for acceleration, not final judgment.
A good rule: AI can organize the signal; product teams must interpret the signal.
30/60/90-Day Implementation Plan
First 30 days: instrument and inspect
Focus on visibility.
Checklist:
- Confirm search tracking is working.
- Capture search terms, clicked results, failed searches, and session behavior.
- Define an initial taxonomy by product area and query intent.
- Review the last 30 days of failed searches.
- Identify the top 10 repeated query clusters.
- Separate obvious content gaps from possible product gaps.
- Create a shared review space for support, product, and customer education.
Deliverable: a baseline knowledge base search report.
Days 31–60: connect and segment
Focus on context.
Checklist:
- Connect search data to support tickets.
- Segment by plan, persona, account tier, lifecycle stage, and product area.
- Identify search-to-ticket conversion by query cluster.
- Add article feedback and chatbot unanswered questions.
- Create a dashboard for product and support leaders.
- Start weekly support/content reviews.
- Start biweekly product triage.
Deliverable: a segmented dashboard with content and product opportunity backlogs.
Days 61–90: score and operationalize
Focus on decisions.
Checklist:
- Add the Roadmap Signal Score.
- Validate high-scoring clusters with tickets, usage data, and interviews.
- Create ownership rules for content, UX, bugs, onboarding, and roadmap items.
- Add knowledge base signals to roadmap review.
- Close the loop with support and success teams.
- Measure changes in failed searches, repeat searches, and ticket correlation.
Deliverable: a repeatable operating model for turning search behavior into roadmap insight.
How to Measure Whether This Process Is Working
The process is working when knowledge base analytics improves both self-service and product decision-making.
Track:
| Metric | What improvement looks like |
|---|---|
| Repeat searches | Users search the same topic less often in one session |
| Zero-result searches | Fewer searches return no useful result |
| Search-to-ticket conversion | Fewer users need support after searching |
| Article helpfulness | More positive feedback on key articles |
| Support resolution speed | Agents resolve known issues faster |
| Tickets for known issues | Recurring tickets decline after content or UX fixes |
| Feature adoption | Adoption improves after UX or onboarding changes |
| Validated roadmap opportunities | More product ideas are supported by evidence |
| Support-product alignment | Fewer repeated escalations without ownership |
Do not measure success only by deflection. A knowledge base can reduce tickets, but it can also reveal when customers need a better product.
Frequently Asked Questions
What is knowledge base analytics for product teams?
Knowledge base analytics for product teams is the process of analyzing help center searches, failed searches, article feedback, chatbot gaps, and support follow-up behavior to identify product friction, unmet needs, UX issues, bugs, and roadmap opportunities.
Which knowledge base metrics matter most for product managers?
The most useful metrics are failed searches, most-searched terms, search-to-ticket conversion, repeated searches, article feedback by product area, searches after releases, and queries segmented by plan, persona, or account tier.
How do failed searches help with roadmap planning?
Failed searches reveal what users expected to find but could not. That may point to missing documentation, poor search relevance, confusing UX, or a feature the product does not yet support. When failed searches are repeated by valuable customer segments, they become useful roadmap signals.
How can product teams avoid mistaking content gaps for feature requests?
Validate each search cluster against existing articles, search result quality, support tickets, product usage, and customer interviews. If the product already supports the workflow but users cannot find or understand it, the solution may be content or UX. If the product does not support the workflow, it may be a roadmap opportunity.
How often should product teams review knowledge base analytics?
Support and content teams should review obvious search and content gaps weekly. Product teams should review high-impact clusters every two weeks. Roadmap-level patterns should be reviewed monthly, with broader trend analysis quarterly.
What tools are needed to analyze knowledge base searches?
At minimum, you need a knowledge base platform with search analytics, a way to export or query data, and a support ticket system. More advanced teams connect GA4 or product analytics, CRM data, usage analytics, session replay, chatbot logs, and roadmap tools.
Can AI turn knowledge base queries into roadmap ideas?
AI can help cluster queries, detect themes, summarize failed searches, and draft recommendations. However, AI should not make final roadmap decisions. Product teams still need customer context, validation, strategic judgment, and effort estimates.
How do you measure the ROI of knowledge base analytics?
Measure reduced failed searches, lower search-to-ticket conversion, fewer repeat tickets, improved article helpfulness, faster support resolution, better feature adoption after UX fixes, and more roadmap opportunities validated with real customer behavior.
Conclusion
Knowledge base analytics is not just a support metric.
For product teams, it is a continuous customer-intent system. Search queries show where users get stuck, what they expect, which workflows confuse them, and which needs are emerging before they appear in formal research.
The best product teams do not treat the knowledge base as a static library. They treat it as a live signal system connected to support, success, product analytics, customer feedback, and roadmap planning.
That is the real value of Knowledge Base Analytics for Product Teams: it turns everyday search behavior into a practical source of roadmap insight.
Start by reviewing the last 30 days of failed searches and grouping them by product area. That single exercise can reveal the first set of roadmap, UX, and documentation improvements worth discussing with your product team.