Independent knowledge base software guide Evidence-led Updated 2026

Benchmarking Knowledge Base Performance: Metrics and Scorecard
Benchmarking knowledge base performance means comparing how effectively people find and use answers under defined conditions. Start with an important user task, establish a reliable baseline, and repeat the measurement after a change. Use evidence of successful task completion to judge the outcome, then search and feedback data to investigate why it changed.
A useful benchmark answers a decision: should you revise an article, improve search, expand a successful approach, or investigate a declining experience? More traffic alone cannot settle those questions. APQC’s measurement guidance distinguishes usage and engagement from evidence that people applied the knowledge.
The workflow below combines metric definitions, an inline benchmarking scorecard, and a hypothetical example. It is designed for customer-facing help centers, with adaptations for internal and agent-facing knowledge.
1. Choose the decision and a defensible comparison
Keep four terms separate. A metric defines what you measure. A baseline records the starting result. A benchmark provides a comparison reference under stated conditions. A target describes the result you want to achieve. A competitor’s percentage is not automatically an appropriate target.
Write a question specific enough to test: After revising onboarding instructions, can customer administrators complete setup more reliably without assistance? Define the audience, tasks, product version, language, access level, channel, and article collection before selecting metrics.
Choose one primary outcome, a few diagnostics, and a guardrail. For onboarding, task completion could be the outcome, unsuccessful searches a diagnostic, and incorrect configurations a guardrail. A guardrail identifies an unacceptable tradeoff: faster completion is not an improvement if users configure the product incorrectly.
Match the comparison to the question
Historical comparisons show whether results changed after an intervention, but other events may explain the movement. Internal segment comparisons reveal differences between tasks, languages, or audiences, provided you account for differences in difficulty and access. Repeatable task or search tests help compare versions under a controlled protocol, although their results may not generalize to all live traffic.
A randomized comparison can provide stronger evidence about a change’s effect when appropriately designed. Microsoft’s experimentation guidance emphasizes a clear hypothesis, suitable success and guardrail metrics, and an appropriate unit of randomization. Decide whether assignment belongs at the user or organization level, and specify the sample plan and stopping rules before interpreting results.
For an internal policy library, successful performance may mean finding the applicable rule and applying it correctly. For agent-facing content, it may mean resolving a supported task accurately. Neither should be compared directly with customer self-service as though the populations and workflows were identical.
Check external benchmarks before adopting them
Inspect the original report’s observation dates, participating organizations, selection method, task scope, metric formula, denominator, and exclusions. Confirm whether the result describes comparable knowledge bases or a broader knowledge management program.
The sources cited in this guide do not establish a universal success-rate target applicable to your collection. Use an external result as context only when its method and population fit your question. Otherwise, establish an internal baseline rather than inventing an industry benchmark or treating one vendor’s case study as one.
2. Define metrics before comparing dashboard numbers
Use the following definitions as proposed measurement conventions, not universal platform standards. For each metric, record the reporting window, eligible audience, exclusions, and data source. Keep the unit explicit: a person, task attempt, search, vote, and session are different observations.
Measure outcomes and effort
| Metric | Calculation and evidence | Interpretation and limitation |
|---|---|---|
| Observed task completion | Unassisted attempts meeting the predefined outcome ÷ all eligible observed attempts × 100. Use task observations or a validated completion event. | Higher is desirable for comparable tasks. Include failures and abandonment; report assisted completion separately. |
| Self-reported resolution | Valid respondents reporting full resolution ÷ all valid respondents to the resolution question × 100. Use a consistently presented survey. | Higher is desirable, but the result describes respondents. Report partial resolution separately and show participation. |
| Time to successful completion | Median elapsed time from the defined task start to verified completion among successful attempts. Use observation timestamps or validated events. | Lower may indicate less effort. Show failures, timeouts, and sample size separately so fast abandonments cannot appear as success. |
For a setup task, success might require the intended setting to be saved and verified—not merely reaching an article. Keep the task wording and completion rule consistent between rounds. GOV.UK’s usability benchmarking guidance recommends realistic tasks with clear outcomes and recording completion, time, and abandonment. That is useful research methodology, not a requirement for US organizations.
Do not substitute time on page for time to completion. Reading longer might reflect careful learning or confusion. Likewise, a reader may find an answer quickly but still fail when applying it.
Use diagnostics to explain the outcome
| Metric | Calculation and evidence | Interpretation and limitation |
|---|---|---|
| Zero-result search rate | Eligible search events returning no results ÷ all eligible search events × 100. Use search logs or a documented platform report. | Lower is generally preferable for answerable queries. Returning irrelevant results can reduce this rate without helping users. |
| Search click coverage | Search events followed by at least one result click ÷ all eligible search events × 100. Link clicks to individual search events. | Measures interaction, not resolution. An answer shown directly on the search page may be useful without a click. |
| Helpful-vote rate | Valid positive votes ÷ valid positive and negative votes × 100. Use article feedback records with a consistent deduplication rule. | Describes submitted votes, not every reader. Inspect comments and feedback exposure before generalizing. |
| Related contact after an article visit | Eligible linked article-view sessions followed by a related support contact ÷ eligible linked article-view sessions with complete follow-up × 100. | Use authorized session and support records. Lower is favorable only if resolution remains sound and support remains accessible. |
For the contact measure, define the topic-matching rule, observation window, tracked support channels, and attribution rule. For example, attribute a contact to the most recent eligible same-topic session. Document how repeat sessions are handled, and report the share of traffic that cannot be linked. Untracked contact is not evidence of no contact.
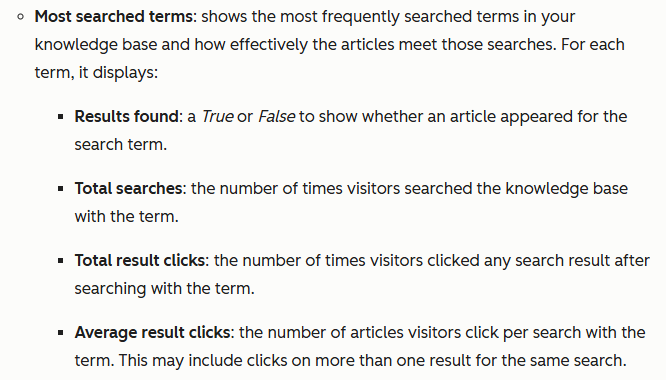
Check product definitions carefully. HubSpot defines average result clicks as articles clicked per search, potentially including multiple results from one search. That differs from the search click coverage defined above. Do not compare them as equivalent percentages or rename either “search success” without outcome evidence.
Keep verified factual defects and access failures visible as guardrails. An edited timestamp is not an accuracy check, and a high average score should not hide a consequential incorrect answer.
3. Separate self-service success from ticket deflection
A self-service activity ratio, a session without tracked contact, and a successfully completed task answer different questions.
Zendesk’s introductory self-service guide defines a score using help-center sessions divided by users who submitted tickets during the same period. This is a channel-activity ratio, not the percentage of visitors who solved their problems. Do not silently replace users with ticket totals or assume the numerator and denominator represent the same people.
Vendor labels also need context. In Zendesk’s documented self-service datasets, a “confirmed deflection” involves selecting a suggested article from the request form and not submitting a ticket during that session. An “assumed deflection” lacks explicit confirmation that an answer was found. The relevant deflection reports track tickets submitted through the help-center request form.
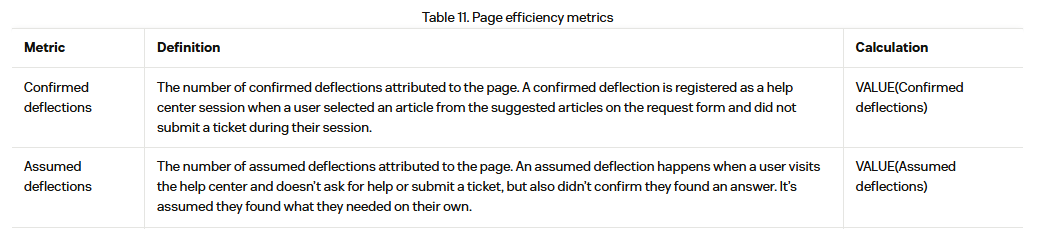
Those definitions describe observable behavior within a particular scope. They do not establish that every person completed their task or avoided contacting support through email, phone, another device, or a later session.
Estimating contacts prevented by a change requires a credible comparison with what would have happened without it. Even genuine self-service success does not always replace a ticket: the KCS v6 measurement guidance recognizes that people also resolve questions they would not have escalated.
Preserve legitimate escalation. Hiding contact options can change a no-contact metric without improving the experience. Track resolution alongside escalation behavior, and investigate abandoned or unobservable journeys instead of classifying them as successful.
4. Build a baseline you can reproduce
Select a period that covers relevant operating cycles and provides enough observations for the decision. A fixed 30-day window is not automatically sufficient. Record releases, incidents, campaigns, access changes, and seasonal demand that could affect interpretation.
Preserve the report or query definition, filters, time zone, data extraction time, and relevant content or system versions. Zendesk’s search dashboard documentation, for example, describes filtering by time, brand, search channel, role, and locale, and notes that refresh schedules depend on the plan. Two screenshots taken at different refresh stages may not represent comparable reporting periods.
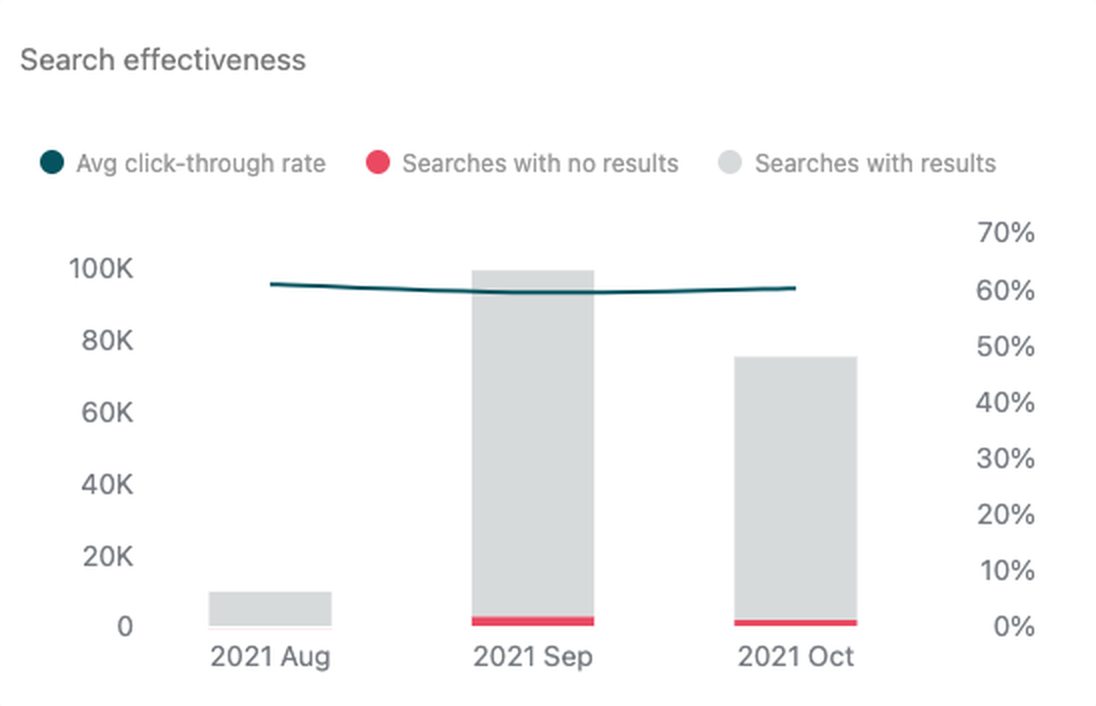
- Validate known journeys. Perform an authorized test search, result click, and support submission. Check that each expected event appears once and is linked correctly.
- Apply consistent eligibility rules. Identify bots, employee testing, duplicates, incomplete sessions, and unsupported audiences. Record exclusions rather than changing them to improve the result.
- Check observation coverage. Confirm that both periods have complete refreshes and follow-up windows. Record retention limits and missing channels.
- Save counts and context. Retain numerators, denominators, task or audience segments, and metric-definition versions. Keep sensitive queries and support details in approved systems.
Mark unavailable data as unavailable. If a denominator is zero, the rate is undefined—not 0% performance. If instrumentation changes, establish a bridging comparison or a new baseline rather than presenting an uninterrupted trend.
Benchmarking without detailed analytics
Start with representative tasks drawn from recurring support questions and important user workflows. Record each participant’s intended outcome, completion result, assistance, elapsed time, and point of failure. Use the same protocol in the next round, while accounting for learning effects if participants return.
A small exploratory study can reveal actionable obstacles without establishing a precise population-wide success rate. Combine its observations with available support themes and feedback, and state the limits of the sample.
5. Use a knowledge base benchmarking scorecard
Reproduce the following field structure in a spreadsheet or reporting document. Use one record per metric and meaningful segment. Keep the measurement record separate from its interpretation so another reviewer can reproduce the result.
| Field group | What to record |
|---|---|
| Decision and scope | The question, primary outcome, audience, task, channel, language, access conditions, and applicable versions. |
| Metric definition | Unit, formula, eligibility, exclusions, observation window, data source, and definition version. |
| Baseline and comparison | Period boundaries, raw counts or sample, result, extraction time, and relevant conditions for each measurement. |
| Change | Percentage-point change for rates, an appropriate unit change for timing, and clearly labeled relative change when useful. |
| Evidence limits | Missing coverage, sample differences, feedback participation, concurrent changes, and uncertainty. |
| Decision and follow-up | Interpretation, next action, accountable owner, guardrail, and the condition or date for retesting. |
Worked example: an apparent improvement needs investigation
All figures below are hypothetical. A software team compares an onboarding help center across two equal reporting windows. Each task-study round contains 200 different participants, each attempting one routine or advanced setup task. Search and feedback figures come from separate live-portal logs, not those study participants.
| Measure | Baseline A | Comparison B | Observed change |
|---|---|---|---|
| Unassisted task completion | 130 of 200 attempts: 65% | 156 of 200 attempts: 78% | Up 13 percentage points |
| Zero-result searches | 60 of 600 searches: 10% | 48 of 800 searches: 6% | Down 4 percentage points |
| Helpful votes | 64 of 80 votes: 80% | 18 of 20 votes: 90% | Up 10 percentage points, with fewer votes |
The completion calculations are 130 ÷ 200 × 100 = 65% and 156 ÷ 200 × 100 = 78%. The difference is 13 percentage points. The relative increase is (78 − 65) ÷ 65 × 100 = 20%. Saying “up 13%” would confuse two different calculations.
The zero-result rate fell by 4 percentage points, equivalent to a 40% relative reduction. That supports investigating better retrieval, not declaring that 40% more users solved their problems. The helpfulness result also needs caution: the second period contains only 20 votes, and the number of people shown the feedback prompt is not supplied.
Check the task mix before announcing success
The fictional task-study results look different when separated by difficulty:
| Task group | Baseline A | Comparison B |
|---|---|---|
| Routine setup | 80 of 100 successful: 80% | 144 of 160 successful: 90% |
| Advanced setup | 50 of 100 successful: 50% | 12 of 40 successful: 30% |
The comparison contains more routine tasks, while advanced-task completion declines. Its aggregate 78% is correctly calculated as (144 + 12) ÷ (160 + 40). Averaging 90% and 30% without accounting for group size would not describe that observed sample.
However, applying the baseline’s fixed 50/50 task mix gives a different, explicitly standardized comparison: (0.5 × 90%) + (0.5 × 30%) = 60%, versus the baseline’s 65%. This adjustment is a diagnostic calculation, not proof of causation or a claim about every customer.
The appropriate decision is to investigate advanced setup before expanding the change. Assign the documentation owner to inspect missing prerequisites and observe failures; assign the analyst to repeat comparisons with a stable task mix. Retain the routine-task result, but do not let it conceal the weaker workflow.
6. Decide whether the evidence supports the conclusion
Before attributing improvement to an article revision, check changes in audience experience, product behavior, support availability, task difficulty, and tracking. A before-and-after score describes an association unless the design adequately addresses other explanations.
Report absolute and relative changes together when both help. For a rate with a zero baseline, relative percentage change is undefined; show the new count and percentage-point change instead. For time measures, report the time-unit difference and ensure the underlying successful-task populations remain comparable.
How much data is enough?
There is no sample size appropriate for every knowledge base decision. NIST’s sample-size guidance ties planning to the quantity being estimated, variability, desired precision, and practical constraints. Detecting a small change generally requires a different plan from identifying a large, reproducible usability failure.
For independent binary outcomes, report a suitable confidence interval alongside the proportion when making inferential claims. NIST describes interval methods for binomial proportions and cautions about simple normal approximations with small samples or few failures.
Do not treat repeated attempts by the same person as independent users. Paired tests, clustered audiences, and independent samples require different analysis. An interval also cannot repair biased recruitment or missing tracking. The fictional scorecard above reports descriptive calculations only; it does not establish statistical significance.
Set a meaningful improvement threshold before judging results, based on user need, risk, and the cost of the change. A detectable difference can still be too small to justify implementation, while a serious access or factual defect may require correction without waiting for a dashboard trend.
7. Add a repeatable search test—and separate AI answer quality
Live search analytics show behavior. A relevance test asks whether the system retrieves useful material for defined information needs. Elastic’s ranking-evaluation documentation describes the essential ingredients: a document collection, representative queries, and relevance judgments for each query.
Build a test set from common user language, recurring failures, important low-volume tasks, and difficult queries. Record each query’s intended task, authorized role, acceptable source, and result judgment. Include unanswerable questions and permission-sensitive cases as separately reported checks.
A simple proposed measure is answerable test queries with at least one relevant result in the top three ÷ all eligible answerable test queries × 100. Define “relevant” as a result containing an accurate, applicable answer for the tested role and task. In an illustrative test, 24 successful queries out of 30 would yield 80%; that is not an industry target.
Compare configurations against the same corpus, permissions, and evaluation queries when isolating search changes. Record version differences when evaluating content changes. Keep evaluation queries separate from tuning material where feasible, and resolve disputed judgments before comparing scores. A useful result in the top three still does not prove the user completed the task.
When the knowledge base generates answers
Evaluate retrieval separately from the response. Microsoft’s retrieval-augmented generation evaluation guidance distinguishes retrieval, groundedness, relevance, and completeness. Finding the correct source and producing a correct answer are separate achievements.
For each tested answer, check correctness for the current task, support from the cited passages, missing essential steps, and appropriate refusal or escalation. An answer can accurately repeat an outdated source and still be wrong. Record unsafe disclosure or fabricated instructions separately rather than allowing a high average to hide them.
Use a defined rubric and human review to check automated evaluations. Preserve model, prompt, source, and evaluator versions. A tool’s default passing threshold is not a universal quality standard, and a search click is not a substitute for either relevance assessment or answer verification.
8. Turn benchmark findings into the next improvement
Close each scorecard review with a specific action, accountable owner, and retest condition. Choose the intervention that addresses the observed failure rather than automatically publishing more articles.
| Observed signal | Investigate before acting | Action and verification |
|---|---|---|
| Frequent searches return nothing | Does a suitable answer exist under different terminology, language, indexing, or permissions? | The content or search owner fixes the identified cause, then repeats the queries and relevant tasks. |
| Clicks rise but task completion falls | Are users opening several weak results, missing prerequisites, or encountering changed product behavior? | The documentation owner observes failures and revises the relevant guidance; retest completion, not clicks alone. |
| Tracked contact falls without better resolution evidence | Did tracking fail, contact options become harder to find, or demand shift to another channel? | The support and analytics owners validate coverage and escalation access before claiming improvement. |
Set targets from the baseline, the importance of the task, and achievable improvements—not an unexplained “good” percentage. Low traffic alone should not trigger deletion, and poor ratings should prompt investigation rather than an assumption that every complaint concerns the writing.
Repeat the benchmark on a cadence suited to your decision cycle, and after material changes to content, search, permissions, tracking, or AI configuration. Keep the old definition and results when establishing a new baseline so apparent improvements remain explainable.
A useful knowledge base benchmark ends with a better-supported decision. Know what the number measures, what makes the comparison fair, what remains uncertain, and which user outcome the next change should improve.
Sources verified: November 3, 2026.