Independent knowledge base software guide Evidence-led Updated 2026

Knowledge base ROI: Formula, worked example, and worksheet
Knowledge base ROI compares the value attributable to a knowledge base with the resources required to build and maintain it. Calculate it for a defined period, separate spending reductions from employee capacity, and make the assumptions visible. A correctly calculated percentage can still be misleading if its benefits are unsupported or counted twice.
Use this project-level formula:
ROI (%) = ((B − C) ÷ C) × 100
B is the attributable, monetized benefit before deducting the project costs in C. C is the corresponding cost of delivering that benefit over the same period. Net benefit is B − C. Do not enter a benefit already net of those costs and subtract them again. If C is zero, the ROI percentage is undefined.
The example below produces a projected 20% first-year economic ROI while remaining $2,400 short of cash payback. Both results can be correct because some benefits represent productive time rather than lower spending. All example figures are hypothetical; the worksheet helps you substitute your own evidence.
Define the investment and the comparison
Specify the collection, audience, supported tasks, channels, currency, and evaluation dates. State whether you are forecasting a new investment, assessing completed work, or deciding whether to renew. Define the counterfactual: what would reasonably happen without the proposed change, including the costs of continuing the current approach.
A historical project assessment includes the implementation resources within its scope. A forward-looking renewal decision instead compares future consequences; money already spent does not become a new avoidable expense. ACCA’s relevant-cost guidance distinguishes decision-driven cash changes from sunk costs and reallocations of unchanged fixed costs.
Keep the first year separate from a mature operating year. Content preparation, training, and adoption may delay benefits even while costs begin immediately. Record the schedule instead of multiplying a fully adopted monthly estimate by twelve.
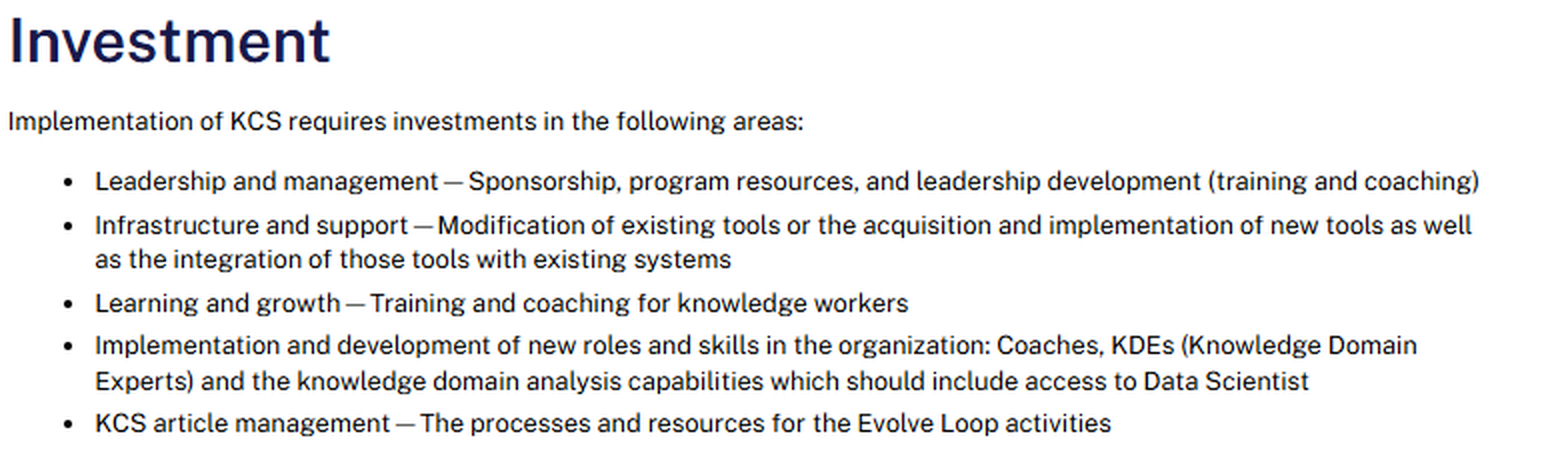
Also distinguish the knowledge base from a broader transformation. Knowledge-Centered Service (KCS) v6’s ROI guidance includes leadership, infrastructure, training, coaching, and content-management investments. A whole KCS program’s return is not evidence of the return from purchasing software alone.
Separate cash savings, cost avoidance, and capacity
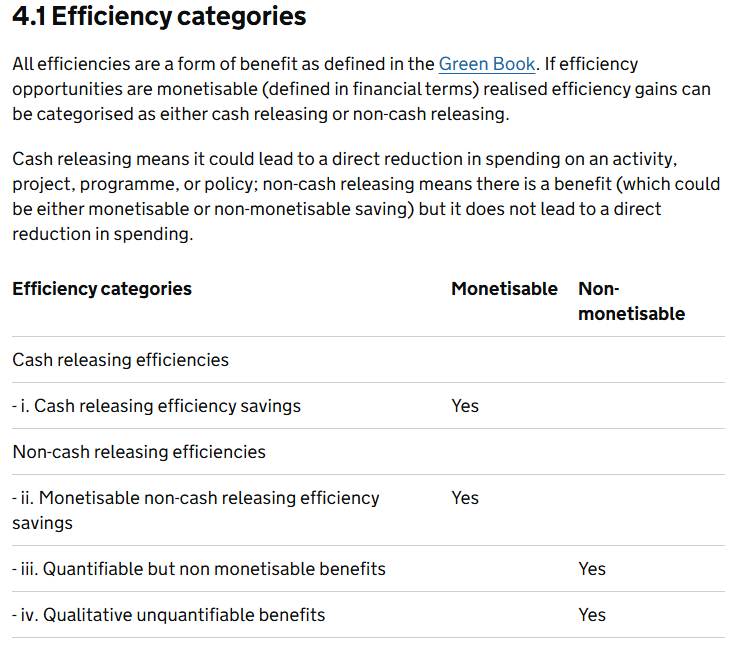
Classify each benefit before assigning dollars. The UK Government Efficiency Framework distinguishes reduced spending from monetizable benefits that leave spending unchanged. That analytical distinction is useful here; it is not a US accounting requirement.
| Benefit type | Example | Evidence needed |
|---|---|---|
| Cash savings | Fewer genuinely billable contractor contacts or reduced overtime payments. | A change in charges or spending attributable to the intervention. |
| Cost avoidance | A documented future staffing increase is no longer necessary. | A credible demand forecast, capacity requirement, and changed funding decision. |
| Capacity value | Salaried employees spend less time finding answers and use that time on other needed work. | Time released, a realistic redeployment plan, and an appropriate valuation rate. |
| Unmonetized outcomes | More consistent answers or less reader effort without a defensible dollar conversion. | Relevant outcome evidence, reported separately from financial totals. |
Do not call unchanged payroll a cash saving. If released time later reduces overtime, count that spending change instead of adding it to the value of the same hours. Similarly, delaying a hire is not permanent avoidance unless the demand and staffing plan support that conclusion.
This guide uses an economic resource model that includes external spending and internal labor value, alongside a separate cash-flow view. It is an undiscounted planning convention, not an accounting-profit calculation. Do not combine noncash benefits with a cash-only cost denominator and label the result realized cash ROI.
Build a cost ledger beyond the subscription
List one-time implementation work and recurring operations separately. The US Government Accountability Office’s cost-estimating guidance emphasizes defined scope, assumptions, data, sensitivity analysis, and updates with actual costs. Apply those principles at a scale appropriate to your project.
Include applicable software, hosting, configuration, integrations, content discovery, migration, writing, technical review, training, accessibility work, and access-control setup. For ongoing costs, include administration, updates, translations, analytics, and support. Not every project needs every category, but an omitted activity needs a reason—not an assumption that staff will do it for free.
For internal work, record hours multiplied by a documented rate. Define what the rate includes and whether it uses paid or productive hours. Do not add allocated salary, a loaded labor charge, and a general overhead percentage for the same resource. Allocate shared platform costs consistently with the benefits being claimed.
Keep incremental invoices separate from existing staff time. Do not count an upfront payment and depreciation of that payment as two cash outflows; ACCA identifies depreciation as a noncash item. Have finance review tax or capitalization treatment when relevant rather than building an unsupported rule into the worksheet.
For AI-enabled knowledge bases, add applicable licensing, usage, evaluation, source maintenance, correction, and human-escalation work. Do not assume every generated answer replaces a paid interaction or that model usage is the only additional cost.
Estimate benefits without overstating attribution
For each benefit, record the eligible population, quantity, unit value, period, evidence, and overlap rule. APQC recommends documenting assumptions and avoiding claims that knowledge management caused an outcome when it only contributed. A reduction after launch does not settle attribution.
Avoided support contacts
A visit, successful self-service interaction, and avoided assisted contact are different events. KCS v6’s self-service measurement guidance notes that customers also resolve questions they would not otherwise have raised with support. Multiplying all visits by a cost per ticket overstates that benefit.
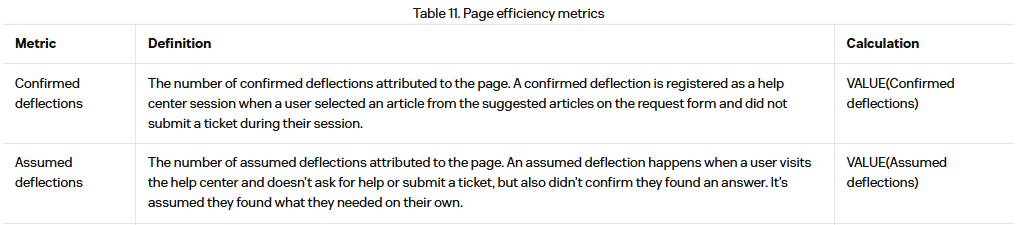
Inspect vendor definitions. Zendesk’s self-service datasets describe a “confirmed deflection” as selecting a suggested article from the request form without submitting a ticket during that session. The documented deflection reports track tickets submitted through the help-center request form. That event does not establish resolution or capture every later phone call, email, or cross-device contact.
When demand changes, a simple baseline calculation can help organize the evidence:
Baseline contact rate = eligible baseline contacts ÷ baseline exposure.
Expected comparison contacts = baseline rate × comparison-period exposure.
Observed difference = expected contacts − actual eligible contacts.
Choose an exposure measure connected to demand, such as active accounts or relevant transactions. Keep topics, channels, exclusions, and follow-up windows comparable. The calculation assumes the baseline rate would otherwise persist; product improvements, seasonality, or changed support access can invalidate that assumption. Preserve negative differences rather than rounding unfavorable results to zero.
Value attributable avoided contacts using costs that actually change. A variable contractor fee may fall; a fixed salary or minimum service commitment may not. An average cost that includes unchanged overhead is not automatically an avoidable cash cost. Do not add session-based deflections to contact-volume reductions when they represent the same work.
Faster handling of work that remains
For an original capacity estimate, use:
Hours released = eligible assisted cases × attributable active minutes saved per case ÷ 60.
Apply this to cases still handled by people, excluding contacts already counted as avoided. Measure active effort, not elapsed resolution time containing queues or customer waiting. Use total minutes or an appropriately weighted mean; multiplying a median by all cases does not establish total time saved.
Compare similar work. If self-service removes easy cases, the remaining workload may be harder; the KCS guidance discusses this shift in assisted demand. Report released hours separately from their value and specify how usable capacity will be redeployed. Do not automatically treat every minute released as an equally valuable additional minute of output.
Internal search, onboarding, and other benefits
For an internal knowledge base, use eligible lookup tasks × attributable active minutes saved ÷ 60, then apply an appropriate value rate and any explicit redeployment assumption. Measure usage rather than assuming every employee saves the same amount every day. If the task count already includes only users of the new system, do not apply adoption a second time.
Do not add search savings already included in agent handling. For onboarding, separate trainee effort, trainer effort, and calendar time to competence. For error reduction, exclude rework already counted elsewhere. Track both employees’ time when they genuinely perform distinct work, not when two labels describe the same minutes.
Include revenue only with defensible attribution and relevant incremental costs: contribution to the business, not gross sales treated as profit. Do not add retained revenue, lifetime value, and the same future margin repeatedly. Keep satisfaction, risk, and quality outcomes outside the dollar total when their valuation is unsupported.
Worked example: calculate first-year knowledge base ROI
Every number in this example is fictional. A support team proposes a customer knowledge base with an agent-facing companion. The comparison is continuing its existing support workflow. The horizon includes an initial payment and months 1–12; all amounts are US dollars in a simplified pre-tax, undiscounted model. These are planning inputs, not prices, customer results, or completed experiments.
Costs and timing
| Cost item | Calculation | First-year value |
|---|---|---|
| External setup and integration | One-time cash payment before month 1 | $12,000 |
| Internal launch work | 120 hours × $50 | $6,000 |
| Software and hosting | $1,000 × 12 months | $12,000 |
| Internal review and administration | 10 hours × $50 × 12 months | $6,000 |
| Total economic cost | $24,000 cash + $12,000 internal resource value | $36,000 |
The $50 project-work rate and $40 agent rate used below are illustrative rates per productive hour, including compensation and benefits. No extra overhead charge is added. Existing salaries remain unchanged. The internal launch hours cover content preparation, validation, and training; ongoing hours are separate. This example assumes no other incremental costs.
Benefits are zero in months 1–2, half of the fully adopted monthly level in months 3–4, and at that level in months 5–12. That equals 9 full-benefit months: 0 + 0 + 0.5 + 0.5 + 8. Recurring costs still run for all twelve months.
Two nonoverlapping benefit streams
Outsourced support: Without the project, the team forecasts 1,500 eligible contractor contacts monthly. The base case assumes the knowledge base prevents 20% at full adoption: 300 contacts. Each avoided contact removes an $8 invoice charge, with no minimum commitment or offsetting charge. This causal effect is an assumption to test, not observed evidence.
Internal agent work: A separate queue contains 1,600 eligible cases monthly at full adoption. The model assumes a three-minute reduction in active effort per case: 80 hours released. Operations expects to redeploy 75% to separately identified backlog work, valued at $40 per hour. That is 60 productive hours worth $2,400 monthly—not a payroll reduction.
The ramp applies to affected contacts and cases: half participation means 150 avoided contractor contacts and 800 eligible internal cases. The redeployment percentage describes use of released time, not adoption. Neither the backlog value nor these handling minutes are counted in another benefit line.
| Benefit | First-year calculation | Value |
|---|---|---|
| Cash spending reduction | 300 contacts × 9 equivalent months × $8 | $21,600 |
| Noncash capacity value | 1,600 cases × 9 × 3 minutes ÷ 60 × 75% × $40 | $21,600 |
| Total monetized benefit | Cash plus capacity, before project costs | $43,200 |
The model therefore contains 2,700 avoided contacts and 14,400 improved internal cases. The latter release 720 hours, of which 540 are assumed to become useful additional work. Valuing those hours at labor cost is a planning proxy, not a measured sales or profit result.
Net economic benefit = $43,200 − $36,000 = $7,200.
Economic ROI = $7,200 ÷ $36,000 × 100 = 20%.
The undiscounted benefit-cost ratio is $43,200 ÷ $36,000 = 1.20: $1.20 of modeled gross benefit per $1 of resource cost. That is not 120% net ROI. The result includes noncash capacity and must not be presented as $43,200 of cash savings.
Calculate cash payback and break-even separately
ACCA defines payback using relevant net cash flows and their timing. Initial investment divided by periodic net cash benefit is a shortcut for suitable regular flows. A delayed launch or changing benefit requires a cumulative schedule.
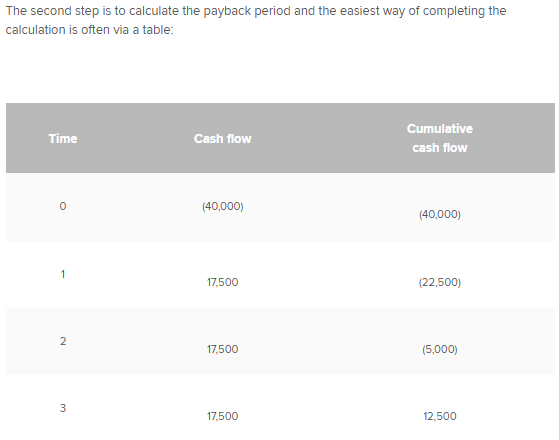
In the example, cash benefits are $21,600 and project cash outlays are $24,000. The first-year cash balance is therefore −$2,400. Unchanged-payroll capacity cannot close that cash gap. Assuming operating payments and avoided charges occur at each month-end:
| Period | Net cash change in the period | Cumulative balance |
|---|---|---|
| Initial payment | −$12,000 | −$12,000 |
| Months 1–2 | 2 × (no benefit − $1,000) = −$2,000 | −$14,000 |
| Months 3–4 | 2 × ($1,200 − $1,000) = $400 | −$13,600 |
| Months 5–12 | 8 × ($2,400 − $1,000) = $11,200 | −$2,400 |
There is no cash payback within year one. If monthly cash benefits remain $2,400, operating cash costs remain $1,000, and no new outlays arise, the balance becomes −$1,000 at month 13 and $400 at month 14. Under that extension and timing convention, cash payback occurs at the end of month 14—not after dividing setup cost by gross benefits.
Economic break-even: Holding the $21,600 capacity value constant, remaining first-year cost is $36,000 − $21,600 = $14,400. At $8 per avoided contact, the project needs 1,800 avoided contacts to break even economically.
Cash break-even: With no other cash benefit, $24,000 ÷ $8 requires 3,000 avoided contacts within year one. The base case has 2,700. These thresholds differ because they answer different questions.
For material multiyear decisions, ask finance to evaluate the timing of future cash flows using an appropriate discounted method, such as net present value. Simple payback ignores later flows and the time value of money, limitations also discussed by ACCA. Do not select a universal discount rate or turn an undiscounted project ROI into an annualized return.
Stress-test the assumptions before requesting funding
The following fictional scenarios change two uncertain inputs together: attributable avoided contacts at full adoption and the share of released agent time redeployed. All other assumptions remain fixed, including $36,000 of costs, the nine-month benefit equivalent, and 720 hours released. These are scenarios, not confidence intervals or probabilities.
| Scenario | Avoided contacts per full month | Time redeployed | Annual benefit | Economic ROI |
|---|---|---|---|---|
| Downside | 150 | 50% | $25,200 | −30% |
| Base | 300 | 75% | $43,200 | 20% |
| Upside | 450 | 100% | $61,200 | 70% |
Also vary one input at a time to identify what drives the decision. With base-case avoided contacts but no monetized capacity benefit, the full-resource ROI becomes ($21,600 − $36,000) ÷ $36,000 × 100 = −40%. That is not cash ROI; it retains all resource costs while testing whether the project is worthwhile without the assumed capacity value.
The next measurements are therefore consequential: confirm that invoices genuinely fall with contact volume, investigate the attributable contact reduction, and verify whether operations can use the released time. Test launch delays and higher maintenance effort rather than assuming the cost estimate cannot move.
When feasible, use a controlled rollout or a suitable comparison group. Microsoft’s experimentation guidance emphasizes an explicit hypothesis, appropriate assignment, success measures, and guardrails. A simple before-and-after comparison needs more cautious interpretation because releases, demand, staffing, and case mix can change simultaneously.
Without advanced analytics, pilot one bounded workflow and record effort, contacts, charges, outcomes, and unresolved attribution questions. Keep missing data distinct from zero. Check repeat contacts and answer accuracy; making help harder to reach is not a legitimate efficiency gain.
A reusable knowledge base ROI worksheet
Reproduce this field structure in a spreadsheet or business-case document. Use one record per cost or benefit stream. It is an input worksheet, not an interactive calculator.
| Field group | Record | Validation question |
|---|---|---|
| Scope and period | Decision, audience, tasks, comparison, currency, dates, forecast or actual status. | Are costs and benefits answering the same question? |
| Quantity and value | Count or hours, units, rate, calculation, timing, one-time or recurring status. | Can another reviewer reproduce the arithmetic? |
| Evidence | Source, observation window, eligibility, exclusions, and measured, estimated, or assumed status. | What supports the input and its attribution? |
| Classification and overlap | Cash, future cost avoidance, capacity, or unmonetized outcome; related entries. | Does this count the same work or money twice? |
| Realization and ownership | Required operational change, responsible owner, next verification, and decision trigger. | Who will make the benefit happen and demonstrate it? |
Add a summary showing cash and internal costs, cash and capacity benefits, economic net benefit, ROI, cumulative cash position, and scenario results. Preserve the original forecast so later revisions remain explainable.
Present a decision, not just a percentage
State the approval requested, funding and staff capacity needed, evaluation horizon, downside, and conditions for proceeding. For the base example, the request involves $24,000 of first-year cash outlays plus 240 internal project hours. The projected result is 20% economic ROI, with cash recovery outside year one and a material dependence on redeployment.
A negative first-year result may reflect startup costs or a slow ramp, but that does not make it acceptable automatically. Show the longer-term assumptions, alternatives, and funding exposure. Use qualitative benefits to inform the decision, not to overwrite an unfavorable calculation.
The sources used here do not establish a universal knowledge base ROI target. Evaluate against your organization’s requirements and comparable alternatives; broader knowledge-management findings and vendor cases do not supply a plug-in return for your project.
After implementation, replace forecasts with invoices, validated time data, and observed outcomes. APQC emphasizes connecting knowledge activity to business results, rather than treating usage alone as value. Record whether discrepancies came from costs, adoption, attribution, or the inability to realize capacity.
A credible knowledge base business case can justify a pilot, expansion, revision, or rejection. Its value is that the next decision rests on traceable costs and benefits—not that the final percentage is always positive.
Sources verified: November 5, 2026.