Independent knowledge base software guide Evidence-led Updated 2026


Calculating Knowledge Base ROI: Formula, Baseline, and Original Lab
Knowledge base ROI compares the measurable benefits attributable to a knowledge base with the full cost of implementing and operating it. The arithmetic is simple; the evidence is not. A credible calculation must define the pre-intervention ticket baseline, keep confirmed self-service outcomes separate from assumed ticket reduction, use costs that actually change, disclose attribution rules, and show how the result changes when uncertain inputs move.
This guide provides the formulas, an evidence hierarchy, a calculator-ready method, and an original 27-scenario sensitivity analysis. The worked data are synthetic planning inputs—not customer results or an industry benchmark—and the complete CSV, JSON, and methodology record are available for inspection.
Calculate your scenario: Use the free Knowledge Base ROI Calculator to separate cashable benefits from capacity value, import a TCO cost model, and estimate ROI, benefit-cost ratio, and payback from your own evidence. No sign-up is required.
Knowledge Base ROI Formula: Quick Answer
ROI (%) = ((Benefits − Costs) / Costs) × 100For a one-year knowledge base analysis:
- Benefits are financially valued outcomes supported by defined evidence, such as avoidable support cost, verified agent capacity released, or measured onboarding time saved.
- Costs include software, implementation, migration, content production, review, training, integrations, analytics, accessibility work, governance, and ongoing maintenance.
A positive result means modeled benefits exceed modeled costs for the stated period. It does not prove causality or guarantee that the benefit will be realized as cash. State the measurement window, evidence rules, exclusions, currency basis, and uncertainty beside the percentage.
The Baseline Ticket Volume Must Be Pre-Intervention
Baseline eligible ticket volume is the observed count of human-handled tickets that would have been eligible for the knowledge-base intervention during a fixed period before the intervention, after applying the same channel, topic, spam, duplicate, and test exclusions used after launch.
“Monthly ticket volume” is not precise enough. If the figure comes from the post-launch period, multiplying it by an assumed deflection percentage understates the demand that existed before the knowledge base and can create a circular estimate.
Record these fields:
- baseline start and end dates;
- included products, topics, languages, channels, and customer segments;
- excluded spam, duplicate, test, bot, and out-of-scope contacts;
- the demand denominator, such as active accounts, orders, transactions, or devices;
- release, incident, pricing, staffing, and seasonality changes;
- the exact same eligibility logic for the post period.
When demand changes, compare rates rather than raw counts:
Baseline ticket rate = Baseline eligible tickets / Baseline exposure

Expected post tickets at baseline rate = Baseline ticket rate × Post exposure

Rate-adjusted decline = Expected post tickets − Observed post eligible tickets
Use a denominator that actually drives contact demand. Active accounts may fit a subscription product; orders may fit ecommerce; installed devices may fit hardware support. Document the choice instead of selecting the denominator that produces the most favorable ROI.
Confirmed Versus Assumed Ticket Deflection
The word “deflection” is used for several different measurements. Keep them separate.
| Evidence class | Example definition | What it supports | Main limitation |
|---|---|---|---|
| Help-center activity | Session, page view, or search | Reach and demand diagnosis | Does not show resolution |
| Self-service ratio | Help-center sessions divided by ticket submitters | Trend monitoring | The numerator is not solved issues |
| No-ticket-after-view | Article view followed by no ticket within a window | Journey-level inference | The visitor may never have intended to contact support |
| Operationally confirmed resolution | Issue-matched completion or explicit solved signal plus no same-issue ticket within a defined window | A stricter observed outcome | Still does not prove the counterfactual without a control |
| Rate-adjusted volume change | Expected tickets at baseline demand minus observed eligible tickets | Business-level change | Product quality, seasonality, incidents, pricing, and channel changes can contribute |
| Causal estimate | Controlled rollout, randomized encouragement, or suitable quasi-experimental model | Stronger attribution | Requires adequate design, sample, and assumptions |
Zendesk’s official self-service reporting documentation defines a self-service score as help-center sessions divided by users who submitted tickets. That can be a useful ratio, but it is not a count of tickets known to have been prevented. Atlassian documents product reports for requests deflected and requests resolved. When using a vendor metric, publish the vendor’s event definition and your configuration.
An Evidence-Bounded Deflection Formula
When you have operationally confirmed self-service resolutions and a larger rate-adjusted ticket decline, do not add both totals. They may describe overlapping journeys. More importantly, a completed self-service journey does not prove that the user would otherwise have opened a ticket. The conversion from an operational resolution to an avoided ticket therefore needs its own explicit displacement factor.
Operational-resolution portion =
min(Operationally confirmed resolutions, Rate-adjusted decline)

Residual decline =
max(0, Rate-adjusted decline − Operational-resolution portion)

Estimated avoided tickets =
(Operational-resolution portion × Resolution displacement factor)
+ (Residual decline × Residual attribution factor)
Use two independently disclosed factors from 0 to 1:
- Resolution displacement factor: the assumed or causally estimated share of operationally confirmed resolutions that replaced a human-handled ticket.
- Residual attribution factor: the assumed or causally estimated share of the remaining rate-adjusted decline caused by the intervention.
- 0: conservative no-attribution boundary.
- 1: upper boundary that attributes the entire relevant portion to the intervention.
Any middle or boundary value is an assumption unless an evaluation design estimates it. Label both factors as assumed or measured. The non-overlapping partition is a bookkeeping ceiling, not proof that the aggregate decline and the operational journeys overlap case by case. If operational resolutions exceed the measured decline, reconcile event logic, demand denominator, timing, and competing volume changes before valuing the result.
Use Marginal Avoidable Cost, Not an Inflated Average
Ticket savings depend on what cost actually changes when a ticket is avoided.
Annual ticket benefit =
Annual estimated avoided tickets × Marginal avoidable cost per ticket
A fully allocated average may include management, rent, annual software contracts, and salaried labor that remain unchanged. If avoiding tickets does not reduce spending, describe the result as capacity released, not cash saved. You may value that capacity when the organization has a documented use for it—handling growth, reducing overtime, improving response time, or redeploying labor—but keep the operational outcome and the monetary valuation visible as separate steps.
| Benefit type | Evidence to collect | Valuation caution |
|---|---|---|
| Avoided outsourced tickets | Invoices or per-contact contract terms | Check minimum commitments and tiers |
| Reduced overtime | Payroll and scheduled hours | Count only overtime actually avoided |
| Agent capacity released | Eligible contacts, handle time, utilization | Do not call it cash unless spending changes |
| Faster assisted resolution | Matched handle-time or resolution-time data | Do not double-count tickets already valued as avoided |
| Employee search time | Task sampling or instrumented workflow study | Self-reported minutes need validation |
| Onboarding time | Time to a defined proficiency outcome | Separate faster completion from better performance |
| Risk reduction | Incident frequency, impact, and control evidence | Use an approved risk model; avoid speculative totals |
Knowledge Base Costs to Include
| Cost category | Examples | Timing |
|---|---|---|
| Software | Subscription, search, AI usage, analytics, environments | Recurring or usage-based |
| Implementation | Configuration, design, security, accessibility, project work | Primarily one-time |
| Migration | Inventory, cleanup, mapping, redirects, validation | One-time plus remediation |
| Content | Research, writing, media, technical review, localization | Initial and recurring |
| Integration | Help desk, identity, product events, CRM, status systems | Initial and recurring |
| Training and change | Author, reviewer, agent, and administrator enablement | Initial and periodic |
| Governance | Ownership, review, legal or policy approval, audits | Recurring |
| Operations | Search tuning, analytics review, content maintenance, incident updates | Recurring |
| Exit and portability | Export, archive, redirect, and migration work | Future or contingency |
Show first-year and steady-state ROI separately. Implementation and migration can make the first year negative even when the recurring-year model is positive.
Original Lab: 27-Scenario Knowledge Base ROI Sensitivity Analysis
On July 28, 2026, we ran a deterministic sensitivity analysis with synthetic planning inputs. It uses no customer records and makes no claim about typical knowledge base performance. The lab crosses three operational-resolution displacement values, three residual-attribution values, and three marginal ticket costs. This makes the otherwise hidden assumption that a completed self-service journey displaced a ticket visible in every result row.
Synthetic Inputs
| Input | Value | Meaning |
|---|---|---|
| Baseline window | 90 days | Pre-intervention comparison period |
| Baseline eligible tickets | 12,000 | Human-handled tickets within the intervention scope |
| Baseline active accounts | 100,000 | Synthetic demand denominator |
| Post active accounts | 105,000 | 5% higher exposure than baseline |
| Observed post eligible tickets | 11,300 | Same scope and exclusions as baseline |
| Operationally confirmed self-service resolutions | 700 | Matched completion or solved event and no same-issue ticket within 72 hours; not causal deflection |
| Operational-resolution displacement | 0%, 50%, 100% | Share assumed or estimated to replace a human-handled ticket |
| Residual attribution | 0%, 50%, 100% | Share of the remaining aggregate decline attributed to the intervention |
| Marginal ticket cost | $8, $12, $16 | Illustrative sensitivity inputs, not market benchmarks |
| First-year cost | $60,000 | Software, implementation, content, training, integration |
| Recurring annual cost | $36,000 | Software and content maintenance |
Derived Ticket Evidence
Baseline rate = 12,000 / 100,000 = 0.12 tickets per active account

Expected post tickets = 0.12 × 105,000 = 12,600

Rate-adjusted decline = 12,600 − 11,300 = 1,300

Operationally confirmed resolutions = 700

Operational-resolution portion = min(700, 1,300) = 700

Residual decline = 1,300 − 700 = 600

Estimated avoided tickets in 90 days =
(700 × resolution displacement) + (600 × residual attribution)
The model annualizes a 90-day estimate by multiplying by four solely for the worked example. Do not annualize a short period when seasonality, releases, incidents, staffing, pricing, or channel migration make it unrepresentative.
Core 3×3 Attribution Grid at $12 Marginal Cost
| Resolution displacement | Residual attribution | Annual avoided tickets | Annual ticket benefit | First-year ROI | Recurring-year ROI |
|---|---|---|---|---|---|
| 0% | 0% | 0 | $0 | −100.00% | −100.00% |
| 0% | 50% | 1,200 | $14,400 | −76.00% | −60.00% |
| 0% | 100% | 2,400 | $28,800 | −52.00% | −20.00% |
| 50% | 0% | 1,400 | $16,800 | −72.00% | −53.33% |
| 50% | 50% | 2,600 | $31,200 | −48.00% | −13.33% |
| 50% | 100% | 3,800 | $45,600 | −24.00% | 26.67% |
| 100% | 0% | 2,800 | $33,600 | −44.00% | −6.67% |
| 100% | 50% | 4,000 | $48,000 | −20.00% | 33.33% |
| 100% | 100% | 5,200 | $62,400 | 4.00% | 73.33% |
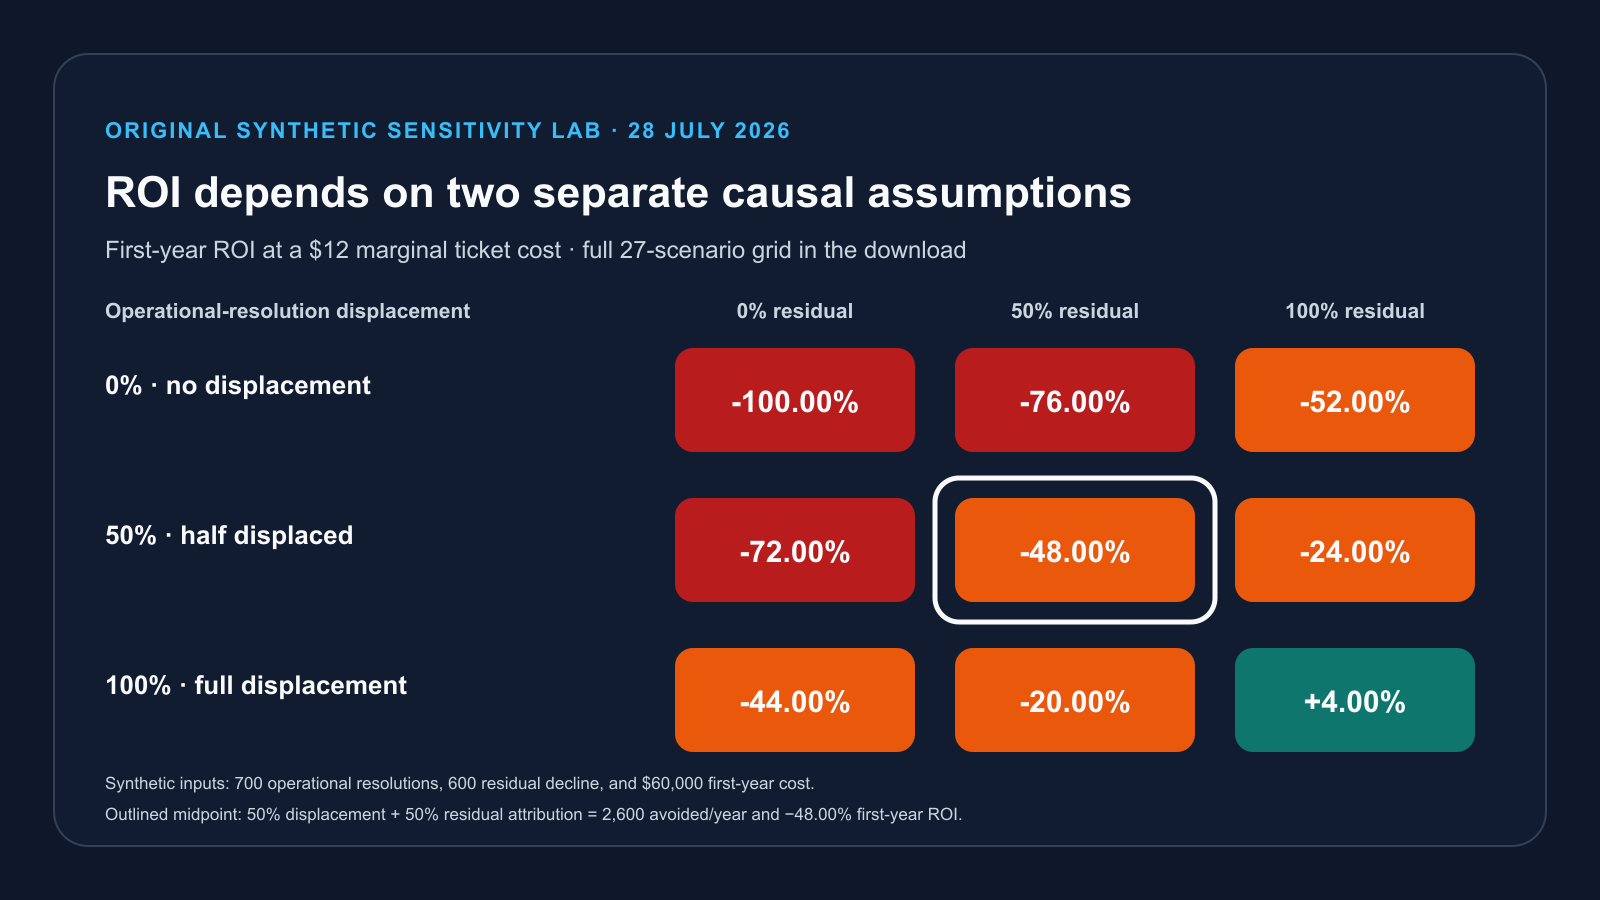
At the midpoint inputs—50% resolution displacement, 50% residual attribution, and $12 marginal cost—the model estimates 2,600 annual avoided tickets and $31,200 annual ticket benefit. ROI is −48.00% in the $60,000 implementation year and −13.33% against the $36,000 recurring cost. Across all 27 rows, changing the three uncertain inputs moves first-year ROI from −100.00% to 38.67% and recurring-year ROI from −100.00% to 131.11%. The former $48,000 midpoint appears only when the model assumes 100% displacement for operational resolutions and 50% attribution of the residual; it is no longer presented as the neutral midpoint.
The analysis intentionally excludes revenue, satisfaction, agent-time, and onboarding benefits. Adding them without independent evidence would make the example look better but less trustworthy.
Artifact SHA-256: assumptions.csv — EA1F547254AD738448A723F5E7948532585837665E81718DFF58F51E8EA3166E; sensitivity-results.csv — 228908C168C4746362E7DC720035CDAC2248550413455D175A71DF12C7C825E4; results.json — 9D6C14E27B530E31F0379990659D60AA7FF4A40174F835227C6382A51C51CB58. The archive also contains the README and complete checksum manifest.
The U.S. GAO Cost Estimating and Assessment Guide identifies a defined baseline, documented assumptions, data collection, sensitivity analysis, and updates with actual costs as elements of a reliable estimate. We used those general estimation principles for the structure of this educational model; the lab is not a GAO-endorsed analysis.
Calculator-Ready Formulas
| Metric | Formula | Evidence note |
|---|---|---|
| Baseline ticket rate | Baseline eligible tickets ÷ baseline exposure | Use the pre-intervention window |
| Expected post tickets | Baseline rate × post exposure | Holds baseline rate constant |
| Rate-adjusted decline | max(0, expected post − observed post) | Not automatically caused by the KB |
| Operational-resolution portion | min(operational resolutions, rate-adjusted decline) | Bookkeeping ceiling rather than observed overlap |
| Residual decline | max(0, rate-adjusted decline − operational-resolution portion) | Prevents adding two overlapping ceilings |
| Estimated avoided tickets | operational portion × displacement + residual × residual attribution | Label both factors as assumed or estimated |
| Ticket benefit | avoided tickets × marginal avoidable cost | Separate cash from capacity |
| Agent capacity hours | eligible assisted cases × verified minutes saved ÷ 60 | Exclude cases already counted as avoided |
| Net benefit | total benefits − total costs | Keep benefit categories mutually exclusive |
| ROI | net benefit ÷ total costs × 100 | State period and cost basis |
| Simple payback | initial investment ÷ monthly net recurring benefit | Only valid when recurring benefit is positive and stable |
How to Calculate Knowledge Base ROI With Your Data
- Define the intervention. State what content, search, AI, workflow, or software changed and when.
- Freeze the scope. Define eligible topics, channels, users, products, languages, exclusions, and demand denominator.
- Choose a comparison window. Prefer a period that represents normal demand and captures relevant seasonality.
- Collect the pre-intervention baseline. Do not reconstruct it from a lower post-launch volume if source records are available.
- Instrument outcomes. Record search, article, completion, escalation, and issue-matched ticket events with privacy review.
- Classify evidence. Keep activity, diagnostic, operational outcome, business change, and causal estimates separate.
- Reconcile overlap. Prevent the same avoided case or time saving from appearing in several benefit categories.
- Use marginal costs. Identify spending actually avoided and capacity actually redeployed.
- Include total costs. Add implementation and recurring ownership, not only the subscription.
- Run sensitivity analysis. Vary the least certain, decision-relevant inputs and explain each range.
- Compare forecast with actuals. Replace assumptions as measured data accumulate.
- Publish limitations. State confounders, missing data, attribution assumptions, and whether results are cash or capacity.
How to Measure Stronger Attribution
A before-and-after comparison is vulnerable to other changes. Depending on risk and traffic, consider:
- Staged rollout: compare similar groups that receive the change at different times.
- Matched cohorts: compare users, products, or regions with similar pre-period demand.
- Interrupted time series: use multiple observations before and after the intervention and model trend and seasonality.
- Randomized encouragement: vary a prompt or article suggestion while keeping support available.
- Issue-level matching: connect the self-service task, completion event, and later ticket topic without exposing unnecessary personal data.
Document product releases, outages, price changes, policy changes, staffing, channel routing, and customer growth. A falling ticket count may be good, but it is not automatically knowledge-base impact.
Agent Time, Employee Search, and Onboarding Benefits
Agent Capacity
Annual agent capacity hours =
Eligible assisted cases × Verified minutes saved per case / 60
Estimate minutes with workflow logs or a designed time study, not a convenient guess. Exclude avoided tickets, because no agent handled them. Value capacity only once.
Employee Search Time
Annual verified hours released =
Eligible employees × Verified minutes saved per work period
× Work periods per year / 60
Use representative tasks and compare the same task set before and after the knowledge change. Search logs alone do not show time saved, and self-reported estimates should be identified as survey evidence.
Onboarding
Define proficiency before assigning value: for example, independently completing a verified task set at an agreed accuracy threshold. Shorter course completion is not sufficient if performance declines.
First-Year ROI, Recurring ROI, and Multi-Year Analysis
Report at least two views:
- First-year ROI: includes implementation, migration, launch content, training, and the first year of operations.
- Recurring-year ROI: includes ongoing software, content, review, integrations, and governance after the initial build.
For multi-year decisions, use discounted cash flow under your organization’s finance policy rather than adding future dollars as if timing and risk do not matter. The U.S. Office of Management and Budget’s Circular A-94 is a public primary example of benefit-cost principles and discounting for federal analyses; it is not a required rate for a private company.
Common Knowledge Base ROI Errors
- Using post-launch ticket volume as the pre-launch baseline.
- Calling every help-center session a solved issue.
- Treating a self-service ratio as a count of avoided tickets.
- Treating every operationally confirmed self-service resolution as one avoided ticket without an explicit displacement estimate.
- Adding operational resolutions to the full ticket decline and counting the overlap twice.
- Ignoring customer growth, orders, devices, seasonality, outages, or product changes.
- Using fully allocated cost per ticket when fixed cost does not change.
- Calling released capacity cash savings without a realized spending change.
- Counting the same labor saving under ticket deflection and faster resolution.
- Excluding content, governance, integration, and accessibility costs.
- Publishing one optimistic estimate without a sensitivity range.
- Annualizing a short launch period that is not representative.
- Presenting a synthetic planning example as customer performance.
What to Show Leadership
- The intervention, audience, scope, and dates.
- The exact baseline and denominator definitions.
- Observed outcomes, modeled assumptions, and causal evidence in separate rows.
- Cashable savings and released capacity separately.
- First-year and recurring costs.
- Low, midpoint, and upper scenarios with defensible reasons for each input.
- Data gaps, confounders, limitations, and the next measurement decision.
- A comparison of the prior forecast with actual results.
Connect the model to the operating plan: which articles, search fixes, integrations, or governance changes produce the next measurable improvement? For broader performance measurement, see our knowledge base performance benchmarking guide.
Frequently Asked Questions
How do you calculate knowledge base ROI?
Subtract total costs from supported benefits, divide by total costs, and multiply by 100. Define the period, baseline, eligibility rules, attribution method, marginal costs, and uncertainty before interpreting the percentage.
What ticket volume should be used for deflection?
Use eligible ticket volume observed before the intervention, with the same topics, channels, exclusions, and demand denominator used after launch. Do not use the lower post-launch volume as if it were the baseline.
Is a help-center session a deflected ticket?
No. A session shows activity. It does not establish that the visitor had a support issue, found the answer, or would otherwise have submitted a ticket.
What is confirmed ticket deflection?
There is no universal event definition. Publish your operational rule. A stricter rule may require an issue-matched task-completion or explicit solved event plus no same-issue ticket within a stated window. Even then, causal proof requires an appropriate comparison or control.
Should average cost per ticket be used?
Use the cost that actually changes when the ticket is avoided. If fixed salaries and systems remain, the result may be released capacity rather than cash savings. Show both where relevant.
What is a good knowledge base ROI?
There is no universal threshold. Compare the result with the organization’s hurdle rate, alternatives, risk, payback needs, and evidence quality. A transparent modest estimate is more useful than an optimistic percentage built on unverified deflection.
Can a knowledge base have negative first-year ROI?
Yes. Implementation and migration costs may exceed first-year benefits while the recurring-year case is positive. The original sensitivity analysis on this page intentionally includes both negative and positive scenarios.
Conclusion
A defensible knowledge base ROI model starts before launch. Freeze an eligible pre-intervention baseline, normalize demand, define operational resolution events, expose the assumed ticket-displacement factor, separate residual attribution, use marginal avoidable costs, prevent double counting, include ownership costs, and show a sensitivity range. The objective is not to manufacture a positive percentage. It is to make a better decision with traceable evidence.
Research disclosure: The sensitivity analysis was run on July 28, 2026 with deterministic formulas and synthetic inputs. It contains no customer or vendor records and is not an industry benchmark. All 27 result rows, inputs, formulas, definitions, and limitations are included in the downloadable CSV/JSON/README package. The 0%, 50%, and 100% attribution values are scenario assumptions, not measured causal effects.