Independent knowledge base software guide Evidence-led Updated 2026

Benchmarking Knowledge Base Performance: Metrics, Formulas, and Lab Results
Measurement guide and original-research framework
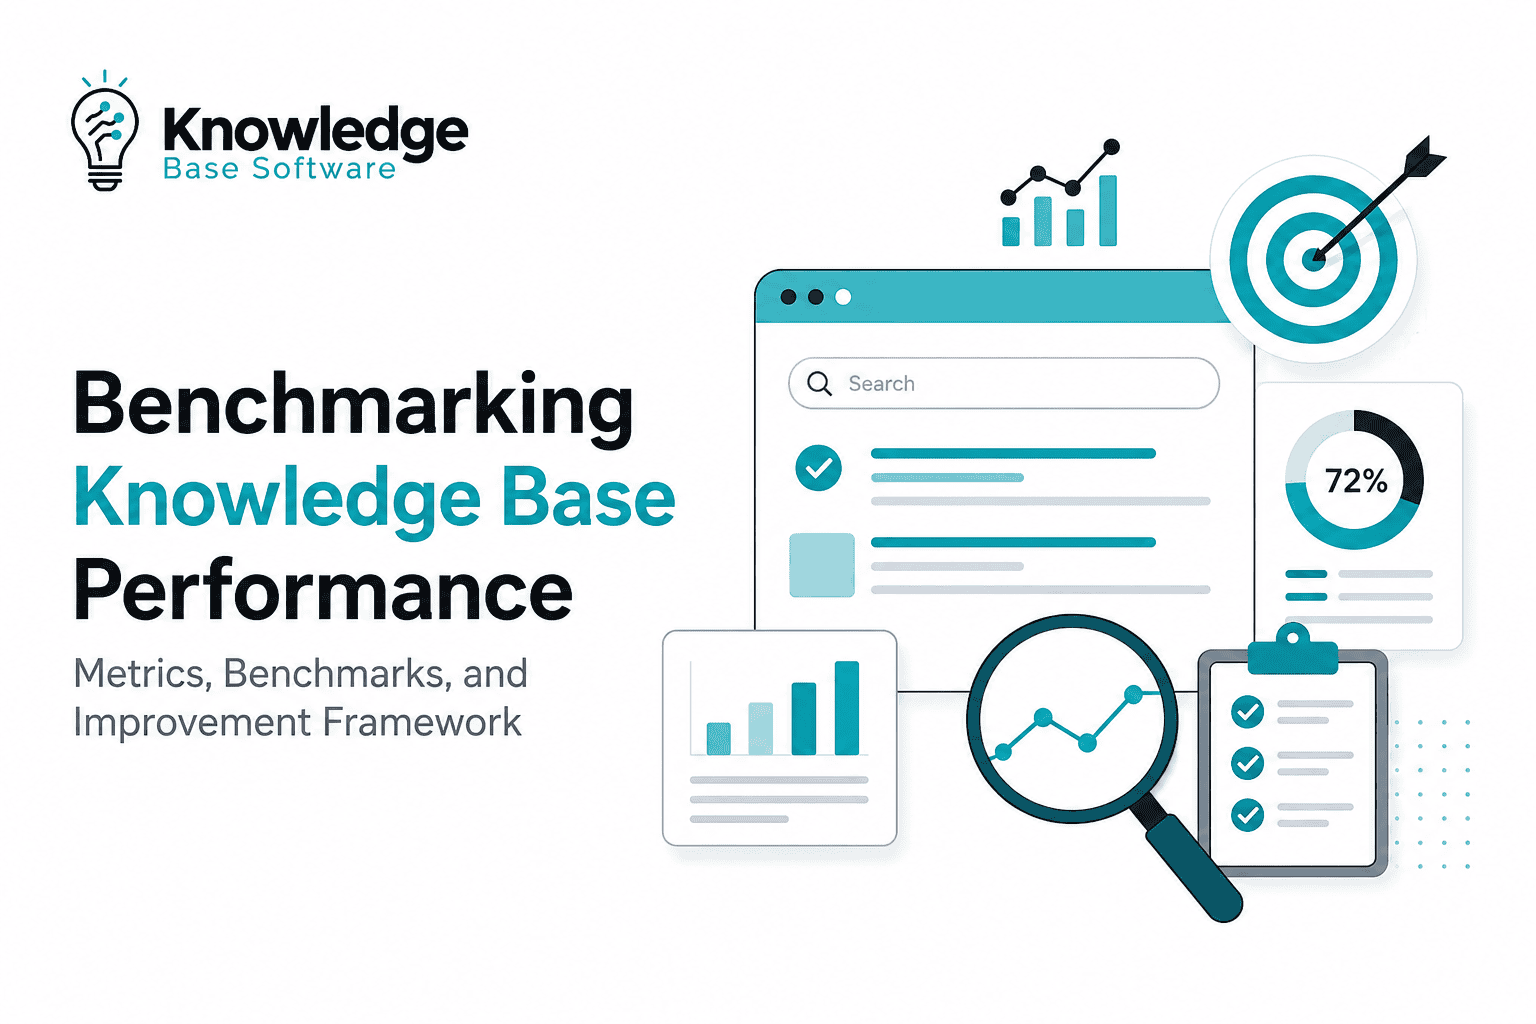
Benchmarking knowledge base performance means measuring whether people can find the right information, use it successfully, and avoid unnecessary effort. It also means measuring whether the content operation can keep answers accurate, current, secure, and available at a sustainable cost.
A useful benchmark is not a universal target copied from another company. A password-reset help center, an internal policy library, developer documentation, and an AI agent do different jobs. They serve different audiences and produce different signals. Their results should not be forced into one generic “good” percentage.
This guide explains what to measure, how to calculate the main metrics, how to build a baseline, and how to test changes without overstating causation. It also provides a publication framework for an original knowledge base search and AI evaluation. Where this page shows an example, it is explicitly labeled hypothetical. It does not present invented industry averages.
Quick answer: benchmark outcomes first, then diagnose them with search, content, operational, and AI metrics. Define every numerator, denominator, eligibility rule, and time window before collecting data. Report the baseline, the change, the sample size, and uncertainty—not just a percentage.
Need a query-by-query search test? Use the free Knowledge Base Search Relevance Benchmark to judge the top five results and calculate Success@1, Success@3, MRR@5, nDCG@5, zero-useful-result rate, and no-answer handling. Keep this offline retrieval test separate from adoption, self-service, and business outcome metrics so you can see where a failure begins.
What is benchmarking knowledge base performance?
Benchmarking knowledge base performance is the disciplined comparison of current results against a relevant reference point. That reference point can be the same knowledge base in an earlier period, a control group in an experiment, another content segment inside the organization, or a standardized lab test applied consistently across several platforms.
Measurement and benchmarking are related but not identical. Measurement tells you what happened: for example, how many searches returned no results. Benchmarking gives that number context: whether it improved after adding missing content, whether one language performs differently from another, or whether a proposed search configuration beats the current one on the same evaluation set.
| Benchmark type | Comparison | Best use | Main limitation |
|---|---|---|---|
| Historical baseline | The same knowledge base before and after a defined change | Monitoring improvement over time | Other events may have caused the change |
| Segment benchmark | Product, language, audience, channel, or article type | Finding hidden weak areas | Segments may differ in difficulty and intent |
| Controlled experiment | Randomized control and treatment experiences | Estimating causal impact | Requires sufficient traffic and reliable instrumentation |
| Offline relevance test | Search or RAG configurations tested on the same queries and ground truth | Improving retrieval and answer quality | Lab performance may not equal live user success |
| Cross-organization benchmark | Comparable metrics from multiple organizations | External context | Definitions, audiences, and sampling often differ |
The strongest starting point is usually an internal baseline. External comparisons can be useful, but only when the participating knowledge bases use compatible definitions and the report discloses how organizations were selected. A single company’s result is a case study, not an industry benchmark. A knowledge base maturity model can help teams interpret improvement without pretending every organization should share the same target.
The five layers of knowledge base performance
A mature scorecard connects five measurement layers. Outcome metrics show whether the knowledge base helped. Search and behavior metrics show how users tried to find answers. Content metrics show whether reliable material existed. Operational metrics show whether the system can be maintained. AI metrics separate retrieval quality from generated-answer quality. Our guide to knowledge base analytics explains how product teams can connect these layers in a reporting model.
1. User and business outcomes
Outcome metrics should match the job of the knowledge base. A customer help center may prioritize confirmed self-service resolution, contact-after-view, customer effort, and time to answer. An internal knowledge base may prioritize task completion, time saved, reduced escalation, and correct use of approved procedures. Developer documentation may prioritize successful integration tasks and fewer documentation-related support requests.
Do not treat article views as an outcome. A page can receive more views because it is useful, because the product is confusing, or because users keep returning after failing to solve the problem. Views describe reach. They need a success or failure signal beside them.
2. Search and discovery
Search metrics reveal whether users can translate their need into a useful result. Track searches with no results, result clicks, repeat or reformulated searches, result rank, and the next action after a click. Intercom’s official Articles report, for example, distinguishes searches with results from searches with no results and reports article engagement and conversations after article views. It also warns that views may include bot traffic, which is a useful reminder to validate traffic before using it as evidence. See the official Intercom Articles report documentation.
For controlled offline tests, use a query set with relevance judgments. Precision measures how many returned items are relevant. Recall measures how much of the known relevant material was retrieved. Mean reciprocal rank rewards placing the first relevant result near the top. Normalized discounted cumulative gain supports graded relevance and rewards useful ordering across several results. Microsoft’s first-party RAG evaluation documentation includes NDCG and related document-retrieval measures when ground-truth relevance labels are available. See Microsoft Foundry RAG evaluators, then use the findings to design a stronger knowledge base search experience.
3. Content health and coverage
Content health metrics ask whether the knowledge base contains an approved answer and whether that answer remains trustworthy. Useful measures include topic coverage, ownership coverage, review-SLA compliance, broken links, duplicate or conflicting articles, content age by risk class, and the percentage of high-impact articles with a named owner.
A global “average article age” is rarely useful. A billing policy or security procedure may need event-driven review, while a stable conceptual guide may remain correct for much longer. Set review rules by risk and change frequency, then measure compliance with those rules.
4. Knowledge operations
Operational metrics show whether the content system can improve sustainably. Track time from identified need to published answer, review turnaround, percentage of flagged articles resolved within the agreed service level, reuse of approved answers, contributor participation, and backlog by risk. These measures should diagnose workflow constraints, not reward publishing volume for its own sake.
5. AI and RAG performance
An AI knowledge base requires two evaluations. First, did retrieval find relevant and sufficient source material? Second, did generation produce a correct, complete, faithful, and properly cited answer? Amazon Bedrock’s official RAG evaluation framework makes the same separation: retrieve-only evaluation includes context relevance and context coverage, while retrieve-and-generate evaluation includes correctness, completeness, helpfulness, logical coherence, faithfulness, citation precision, citation coverage, and harmfulness. See the Amazon Bedrock RAG evaluation metrics. For implementation context, see our guides to RAG knowledge bases and AI answer quality testing.
Permissions need their own adversarial tests. Do not infer security from answer quality. AWS also documents that Bedrock guardrails apply to the input and generated response, not automatically to references retrieved from a knowledge base at runtime. That product-specific limitation illustrates why teams must test the complete retrieval path rather than assume a response guardrail protects every source. See the official RetrieveAndGenerate documentation.
Knowledge base performance scorecard
Select a small number of primary measures and use the rest as diagnostics. The scorecard below does not contain universal targets. Your baseline, audience, task difficulty, and measurement method determine what change is meaningful.
| Metric | What it answers | Required data | Important caveat |
|---|---|---|---|
| Confirmed self-service resolution | Did the user solve the intended task without assisted support? | Explicit confirmation or validated task event, session, support contact | No-contact alone does not prove resolution |
| Self-service ratio | How does help-center use compare with users submitting tickets? | Help-center sessions and users in tickets for the same period | It is an activity ratio, not causal deflection |
| Contact-after-view | How often does a related support contact follow an article view? | Identity or session linkage, article topic, ticket topic, time window | Match the topic; do not count every later ticket |
| Search success | Did a search produce evidence of a successful outcome? | Query, results, clicks, task event or no-contact rule | Define “success” before collecting data |
| Zero-result rate | How often does search return nothing? | All valid searches and zero-result searches | Exclude bots, tests, and malformed requests by a fixed rule |
| Reformulation rate | How often does a user revise a query in the same task? | Ordered search events within a session | A second query can be exploration, not always failure |
| Content coverage | Do important issue clusters have approved answers? | Issue taxonomy, ticket volume, article-to-topic mapping | Weighting by volume can hide rare high-risk gaps |
| Review-SLA compliance | Are articles reviewed according to their risk? | Owner, risk class, due date, completed review date | A completed review does not guarantee accuracy |
| Time to publish or correct | How quickly does the operation respond to a verified need? | Demand timestamp, workflow events, publication timestamp | Separate routine and high-risk changes |
| Retrieval relevance | Does search or RAG retrieve useful sources? | Query set, retrieved results, relevance judgments | Requires defensible ground truth |
| Answer faithfulness | Are generated claims supported by retrieved sources? | Response, source passages, claim-level review | Faithful can still be incomplete or based on a wrong source |
| Citation quality | Do citations support the associated claims, and are key claims cited? | Response claims, citations, source passages | Count precision and coverage separately |
| Permission leakage rate | Does the system expose restricted information? | Adversarial queries, test identities, expected access rules | Any failure requires investigation; an average can conceal severity |
Knowledge base benchmarking formulas
Formulas are useful only when their event definitions are stable. Store the formula, eligibility rule, deduplication rule, attribution window, and excluded traffic with each dashboard metric.
Self-service ratio
Self-service ratio =
Eligible help-center sessions
÷ Unique users who submitted tickets in the same period
Zendesk documents a self-service score using help-center user sessions divided by users in tickets and recommends comparing matching periods after several months of activity are available. See Zendesk’s official self-service metrics guide. Treat this as a ratio of channel activity. It does not prove that each session prevented a ticket.
Confirmed self-service resolution rate
Confirmed resolution rate =
Eligible sessions meeting the predefined success rule
÷ All eligible self-service sessions
A success rule could require an explicit “this solved my problem” response, a verified product task, or a combination of article use and no related contact within a stated window. Report which rule you used. Do not combine explicit confirmation and inferred success without showing them separately.
Incremental ticket reduction in an A/B test
Absolute treatment effect =
Ticket submission rate in the control group
− Ticket submission rate in the treatment group

Relative reduction =
Absolute treatment effect
÷ Ticket submission rate in the control group
This formula supports a causal interpretation only when eligible users are randomized correctly, treatment assignment remains stable, support is not unfairly obstructed, and the analysis follows a plan defined before the results are viewed.
Search and content formulas
Zero-result rate =
Valid searches returning zero results
÷ All valid searches

Search reformulation rate =
Search sessions containing a revised query within the defined window
÷ All eligible search sessions

Article helpfulness rate =
Valid positive responses
÷ All valid positive and negative responses

Contact-after-view rate =
Users creating a related support contact within the attribution window
÷ Eligible article viewers

Issue-weighted content coverage =
Volume of in-scope issues mapped to an approved article
÷ Total in-scope issue volume

Review-SLA compliance =
Articles reviewed by their risk-based due date
÷ Articles due for review
Engagement metrics need careful interpretation. Google Analytics defines an engaged session using time, key-event, or page-view criteria and defines bounce rate as the percentage of sessions that were not engaged. A user can solve a short documentation task and leave without creating a long session, so neither engagement nor bounce proves success on its own. See Google’s official GA4 engagement and bounce-rate definitions.
AI answer formulas
Claim-level faithfulness =
Factual claims supported by retrieved source content
÷ All factual claims in the response

Citation precision =
Citations that support the associated claim
÷ All citations

Citation coverage =
Factual claims requiring support that have a valid citation
÷ All factual claims requiring support

Permission leakage rate =
Restricted-answer disclosures
÷ Valid permission-adversarial attempts

Cost per confirmed AI resolution =
In-scope retrieval, model, and platform cost
÷ Confirmed successful AI resolutions
Automated evaluators can help scale review, but a score produced by another model is still a measurement instrument. Validate it against human judgments, preserve the evaluator prompt and version, and report disagreements. High-risk, permission-sensitive, and refusal cases should receive human review.
Data required for defensible benchmarking
Decide what can be linked safely before implementation. If article views cannot be connected to later support contacts, say so. Do not manufacture attribution by dividing unrelated totals.
- Search events: timestamp, pseudonymous session or user ID, query, result IDs and rank, filters, zero-result flag, clicked result, and reformulation sequence.
- Article events: article ID, version, language, product area, audience, view, feedback, task event, and next action.
- Support events: pseudonymous requester ID, ticket time, normalized issue topic, source channel, and whether a relevant article or answer was shown.
- Content inventory: owner, risk class, publication and review dates, status, language, permissions, related issue clusters, and replacement or redirect relationships.
- AI and retrieval logs: user question, retrieved chunk IDs and rank, model and prompt version, response, citations, latency, token or usage cost, refusal, escalation, and feedback.
- Experiment data: eligibility, assigned group, exposure, outcome, exclusion reason, and the analysis unit such as user or account.
- Change log: content edits, taxonomy changes, synonym updates, search configuration, model changes, prompt changes, incidents, and product releases.
Remove bots, internal QA, uptime checks, and malformed requests according to a written rule applied to every comparison period. Use pseudonymous identifiers, minimize retained personal data, and document retention and access controls. If multilingual reports aggregate all variants, split the underlying data before drawing language-specific conclusions.
How to benchmark knowledge base performance step by step
Step 1: Define the decision
Start with the decision the benchmark must support. “Measure the knowledge base” is too broad. A defensible question is narrower: Should we keep the new search configuration? Which product area needs a knowledge base content audit? Does showing a relevant article before the contact form reduce related ticket submission without lowering satisfaction?
Step 2: Choose one primary outcome
Select one primary outcome before looking at the result. Supporting metrics explain why it changed. If every metric is treated as primary, it becomes easy to promote the one favorable result and ignore the rest.
Step 3: Write the metric contract
For every metric, record the numerator, denominator, analysis unit, deduplication rule, time window, attribution logic, segmentation, exclusions, source systems, and owner. Version this contract when a definition changes. Do not draw a trend line across incompatible definitions.
Step 4: Validate instrumentation
Run known test journeys and confirm that the expected events appear once, in order, with the correct identity and topic. Check time zones, duplicate events, consent behavior, cross-domain tracking, logged-out users, and ticket-channel coverage. An A/A test—where both randomly assigned groups receive the same experience—can expose allocation or tracking problems before a real experiment.
Step 5: Establish the baseline
Use a period that covers the operating cycle and known weekly patterns. Record releases, incidents, campaigns, migrations, and seasonal events that could change demand. Segment before averaging: product, language, audience, issue type, channel, and device can have materially different intent.
Step 6: Choose an appropriate test
- Use a randomized experiment when you need causal evidence and can assign eligible users safely.
- Use an interrupted time-series or matched before-and-after analysis when randomization is not possible, while acknowledging alternative explanations.
- Use an offline query set when comparing search, retrieval, reranking, chunking, or prompt configurations.
- Use moderated task testing to understand why users fail, not to manufacture a population-wide percentage from a handful of participants.
Step 7: Set sample size and stopping rules in advance
Sample size depends on the baseline rate, the smallest change worth detecting, the desired confidence level and power, repeated users or accounts, and expected exclusions. Do not copy a universal minimum. Calculate the requirement for the planned comparison and do not repeatedly inspect the data and stop as soon as a favorable result appears.
NIST explains confidence intervals as ranges generated by a method that would contain the population parameter at the stated rate over repeated samples. It also emphasizes experimental-design choices and replication. Use the NIST confidence-interval guidance and NIST experimental-design guidance when preparing the analysis plan.
Step 8: Analyze uncertainty and practical significance
Report the raw counts, rate or median, absolute difference, relative difference where helpful, and a confidence interval. A statistically detectable change may still be too small to justify implementation. A useful change may remain uncertain when the sample is small. State both.
Step 9: Investigate segments without hiding the overall result
Segment analysis can uncover a failing language, account tier, product area, or high-risk workflow. Mark unplanned segment analysis as exploratory, especially when many comparisons were tried. Publish the overall result and explain which segment findings need confirmation.
Step 10: Turn the finding into a controlled improvement cycle
Assign an owner and a next action. Missing queries may require a ticket-to-article workflow, synonyms, or better titles. Relevant results with poor task success may require applying a consistent knowledge base style guide. Good retrieval with unfaithful AI answers points toward generation or prompt controls. Permission failures require incident handling, not ordinary search tuning. A knowledge base governance framework should assign owners and review triggers to each resulting action.
Original knowledge base performance experiment
Study status: Completed July 28, 2026. This is a controlled synthetic content lab, not a vendor comparison or an industry benchmark.
Research question and method
We built two task-equivalent English knowledge base corpora with 48 articles each. Both variants contained the same underlying tasks, interface paths, and troubleshooting facts across account, billing, workspace, data, integration, and security topics. Variant A used inconsistent internal titles, dense prose, and incomplete customer vocabulary. Variant B applied a defined content intervention: user-task titles, short summaries, customer synonyms, explicit interface paths, direct steps, and troubleshooting language.
We indexed both variants with the same deterministic BM25 implementation and the same settings: k1=1.5, b=0.75, title weighting ×3, summary weighting ×2, body weighting ×1, and a top-10 result window. The primary metric was Success@3 on answerable queries. Secondary measures were Success@1, MRR@10, query-type results, unanswerable-query behavior, readability, and five selected content-accessibility checks.
The query set and relevance labels were fixed before scoring. We used 10,000 paired bootstrap resamples with random seed 20260728 to estimate 95% intervals for the Success@3 and MRR differences. No commercial platform, customer data, affiliate relationship, generative model, or paid account was involved.
Corpus and query profile
| Test component | Sample |
|---|---|
| Matched articles | 48 in Variant A and 48 task-equivalent articles in Variant B |
| Direct-task queries | 48 answerable queries |
| Customer-synonym queries | 48 answerable queries |
| Troubleshooting queries | 48 answerable queries |
| Unanswerable queries | 18 deliberately out-of-scope queries |
| Readability sample | All 48 matched article bodies |
| Selected content checks | 24 matched HTML article pairs across five rules |
Exact SHA-256 identifiers were retained for audit: Variant A corpus e3d7bc33b1860a731fe79e6364b1496b43d8b5481b13a5d3d146675e8193ae8f; Variant B corpus eefa9bc0dad63e38f0a16b54aca7960559539fe962c3c49627e3561b63e86ce8; query set c93b3db78b2f1752d95d1ec5d2874170ae700e264955b09a8e844e77b6395dab.
A fair multi-platform test uses the same approved corpus, metadata, permissions, queries, and relevance judgments wherever the platform supports them. If a feature cannot be configured equivalently, report the difference. Do not silently substitute a vendor’s public help center, because a different corpus changes the task.
Results
| Metric | Variant A | Variant B | Observed difference |
|---|---|---|---|
| Success@1, 144 answerable queries | 70.8% | 98.6% | +27.8 percentage points |
| Success@3, 144 answerable queries | 79.2% | 100.0% | +20.8 points; 95% bootstrap interval: +14.6 to +27.8 |
| MRR@10 | 0.751 | 0.993 | +0.242; 95% bootstrap interval: +0.176 to +0.310 |
| Customer-synonym Success@3, 48 queries | 68.8% | 100.0% | +31.2 percentage points |
| Troubleshooting Success@3, 48 queries | 75.0% | 100.0% | +25.0 percentage points |
| Unanswerable queries returning zero results, 18 queries | 44.4% | 38.9% | −5.5 percentage points |
Supporting content diagnostics moved in the same direction: median Flesch Reading Ease increased from 1.8 to 69.9, median Flesch-Kincaid Grade fell from 19.1 to 5.6, and 102 instances flagged by five selected content checks across 24 Variant A samples fell to zero in Variant B. These mechanical checks do not prove comprehension or WCAG conformance.
On this synthetic set, clearer task titles and customer language substantially improved retrieval. The negative result also matters: broader vocabulary made Variant B match more out-of-scope queries. In a production system, that tradeoff should trigger separate threshold, refusal, and escalation tests rather than a claim that more retrieval is always better.
The result is evidence about this disclosed corpus and intervention. It is not a universal “good” search-success target and does not rank knowledge base products.
Limitations
- The corpus and queries were synthetic, English-language, and limited to six operational topic groups.
- No people participated, so the lab does not measure comprehension, task-completion time, satisfaction, customer effort, or ticket reduction.
- The test used one deterministic lexical ranking method; semantic, hybrid, permission-aware, and generative systems need separate evaluation.
- The readability formulas are mechanical indicators, not proof that a reader understood the answer.
- The accessibility review covered five content rules on 24 pairs. It was not a complete WCAG conformance audit.
- The observed improvements must not be generalized to other corpora, languages, products, or search configurations without replication.
Lab results measure performance on the disclosed corpus, configuration, query set, dates, and accounts. They do not prove how every customer deployment will perform. Product interfaces, search indexes, AI models, and plan entitlements can change, so preserve a dated version of the evidence and rerun material tests after major changes.
Worked examples—hypothetical only
The numbers in this section are invented solely to demonstrate calculations. They are not observations from this site, vendor benchmarks, or recommended targets.
Hypothetical example 1: zero-result searches
Assume a cleaned dataset contains 2,000 valid searches and 160 return no results. The zero-result rate is:
160 ÷ 2,000 = 0.08, or 8%The result does not prove that 92% of searches succeeded. Searches with results can still return irrelevant articles. The next analysis should examine result clicks, reformulation, rank, and task completion for the highest-volume queries.
Hypothetical example 2: contact after article view
Assume 800 eligible users view a billing article and 96 create a billing-related ticket within the predefined 48-hour attribution window:
96 ÷ 800 = 0.12, or 12%Do not count unrelated tickets, and do not describe the remaining 88% as deflected without confirmation. Some users may have solved the issue, abandoned it, changed channel, or never intended to contact support.
Hypothetical example 3: randomized article suggestion
Assume eligible users entering a support flow are randomized. In the hypothetical control group, 420 of 1,000 users submit a related ticket. In the treatment group, which receives a relevant article suggestion without blocking support, 360 of 1,000 submit a related ticket.
Control ticket rate = 420 ÷ 1,000 = 42%
Treatment ticket rate = 360 ÷ 1,000 = 36%
Absolute difference = 42% − 36% = 6 percentage points
Relative reduction = 6 ÷ 42 = approximately 14.3%
A real report must add a confidence interval, preplanned exclusions, allocation checks, satisfaction or effort guardrails, and the test duration. The arithmetic alone does not validate the experiment.
Hypothetical example 4: citation quality
Assume reviewers identify 50 citations in a sample of generated answers, and 44 support the associated claim. They also identify 60 factual claims that require support, of which 42 have a valid citation.
Citation precision = 44 ÷ 50 = 88%
Citation coverage = 42 ÷ 60 = 70%
The example shows why precision and coverage must remain separate. The citations that appear may be mostly correct while many important claims remain uncited.
How to report knowledge base benchmarks without misleading readers
- Use accurate labels. Call one organization a case study, a standardized software test a lab benchmark, and a randomized test an experiment.
- Publish dates and versions. Search and AI systems change. A result without a date can become misleading quickly.
- Show denominators. “Accuracy was 90%” is incomplete without the number and type of evaluated questions.
- Separate observed, inferred, and vendor-documented facts. Use “we measured,” “we inferred,” and “the vendor documents” deliberately.
- Report uncertainty. Include confidence intervals and explain when the sample cannot distinguish a meaningful difference.
- Publish negative and null results. Do not remove a product or segment because it weakens the narrative.
- Preserve the evaluation set. Store the corpus version, queries, relevance judgments, scoring rubric, configuration, and analysis code or calculations.
- Disclose commercial relationships. Affiliate links, sponsorship, vendor access, and supplied accounts belong in the method.
- Protect users. Remove personal data, secure raw logs, and describe consent, retention, and access practices.
A benchmark should make a decision easier while making its own limitations visible. If a reader cannot tell what was tested, how success was defined, or how many observations were included, the result is not ready to support a buying or operational decision.
Knowledge base benchmarking checklist
- Write the decision, hypothesis, primary outcome, and smallest meaningful change.
- Define every metric’s numerator, denominator, time window, unit, and exclusions.
- Validate events using known journeys and check bot and employee traffic.
- Record a baseline that covers relevant operating cycles.
- Segment by audience, product, language, task, and risk before averaging.
- Choose randomization, time-series analysis, offline evaluation, or usability research according to the question.
- Calculate sample size and stopping rules before reviewing treatment results.
- Separate retrieval, generation, citation, refusal, escalation, and permission testing.
- Use at least two independent reviewers for a meaningful subset and adjudicate disagreements.
- Report counts, estimates, confidence intervals, missing data, and limitations.
- Assign an owner and repeat the benchmark after material content or system changes.
Knowledge base performance benchmarking FAQ
What is the most important knowledge base performance metric?
The most important metric is the outcome that matches the knowledge base’s job. For customer support, that may be confirmed self-service resolution with satisfaction or effort guardrails. For an internal knowledge base, it may be correct task completion and time to answer. Search and article metrics diagnose that outcome; they should not replace it.
What is a good knowledge base deflection rate?
There is no defensible universal rate for every audience, product, and attribution method. First define whether “deflection” means a self-service ratio, no contact after a visit, explicit resolution, or an incremental difference in a randomized experiment. Establish your own baseline and report the exact method. Do not compare percentages produced by different definitions.
Is the self-service ratio the same as ticket deflection?
No. A self-service ratio compares help-center use with users submitting tickets in the same period. It is useful for tracking channel adoption, but it does not show which visitors intended to contact support or successfully resolved a problem. Causal ticket reduction requires a stronger design, ideally randomized exposure to a self-service treatment.
How often should a knowledge base be benchmarked?
Operational dashboards may run continuously, while formal reviews can follow product releases, migrations, model changes, taxonomy changes, or an agreed monthly or quarterly cycle. Use the same metric definitions across periods. Rerun offline search and AI tests after material changes to the corpus, retrieval configuration, model, prompt, permissions, or ranking system.
How many queries are needed to test knowledge base search?
There is no universal minimum. The query set must represent common, long-tail, ambiguous, misspelled, no-answer, multilingual, and permission-sensitive cases relevant to the deployment. Determine the sample from the precision required for the planned comparison, and publish the query composition. A larger but unrepresentative set is not automatically better.
Can an LLM evaluate another AI knowledge base?
It can assist, but its judgment should be treated as an instrument that needs validation. Preserve the evaluator model, version, prompt, and rubric. Compare a meaningful sample against independent human judgments, report agreement and disagreements, and require human review for high-risk, refusal, citation, and permission cases.
Why can bounce rate be misleading for a knowledge base?
A user may open one concise article, complete the task, and leave. That can be a successful session even if engagement rules classify it differently. Interpret bounce or engagement alongside task completion, contact-after-view, helpfulness, search behavior, and explicit feedback.
How should multilingual knowledge bases be compared?
Report each language separately before presenting a global figure. Use natural queries from fluent speakers, not only literal translations. Check article coverage, search behavior, relevance, generated-answer quality, escalation, and sample size by language. An aggregate can conceal a serious failure in a lower-volume locale.
When can a result be called an industry benchmark?
Only when it comes from a disclosed multi-organization methodology with compatible metric definitions, a defensible selection process, adequate representation, and organization-level results that prevent one large participant from dominating the aggregate. Otherwise, use “case study,” “internal baseline,” or “lab benchmark.”
Primary methodology and product sources
- Zendesk Documentation Team: tracking essential self-service metrics
- Intercom Help: Articles report
- Google Analytics Help: engagement rate and bounce rate
- Amazon Bedrock: RAG evaluation metrics
- Amazon Bedrock: RetrieveAndGenerate behavior and guardrail note
- Microsoft Learn: RAG evaluators and document-retrieval metrics
- NIST/SEMATECH: confidence intervals
- NIST/SEMATECH: choosing an experimental design
Final recommendation
Benchmarking knowledge base performance should reduce uncertainty, not manufacture certainty. Define the job, select one primary outcome, validate the data, and compare like with like. Use search and content metrics to diagnose user outcomes. Separate retrieval from generation in AI systems. Use experiments when you need causal claims, and label examples, case studies, and lab results accurately.
Once the attribution rules are defensible, use the verified outcomes—not assumed deflection—to calculate knowledge base ROI.
The most useful benchmark is one your team can reproduce, explain, and act on. A smaller transparent study is more credible than a precise-looking target with no disclosed sample, method, or evidence.